The Met Office issues yellow, amber and red warnings of severe weather across the UK. With clear, timely information it is hoped that the public can make well-informed decisions and preparations to keep themselves, other people, homes and businesses safe. There are various parts to a warning; the colour, the matrix and the accompanying text.
The warnings deal with heavy rain, thunderstorms, wind, snow, lightning, ice, extreme heat and fog, up to seven days ahead.
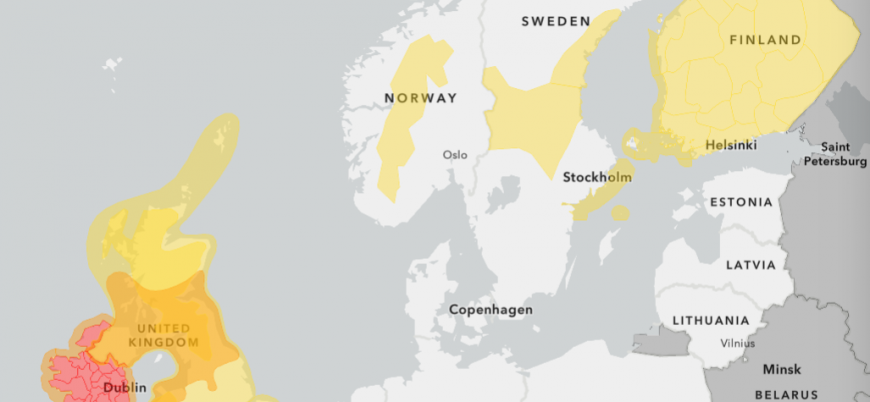
The warning system is colour-coded, similar to traffic lights, to highlight upcoming potentially dangerous weather conditions. The colour levels appear after considering the likelihood of severe weather compared to the potential impacts. Unlikely but potentially High impact, like lightning strikes or Likely to see Low impacts, say from passing heavy rain. A coloured area is shown on a map of the UK. Often there are several warnings in one event, especially if it is a named storm. Red is the highest level of warning in the UK and indicates a significant risk to life and property. The advice has to be stay indoors and to follow the instructions from emergency services and local authorities.
Don’t just look at the colour
All yellow warnings are not the same. There is accompanying text and explanation from a forecaster attached to each warning. The colour of a warning on its own is not enough. The matrix, showing impacts against likelihood, is a key part of understanding each warning.
There are two important ingredients to each warning which can result in very different messages across the five different yellow warning types or the four different amber warnings.
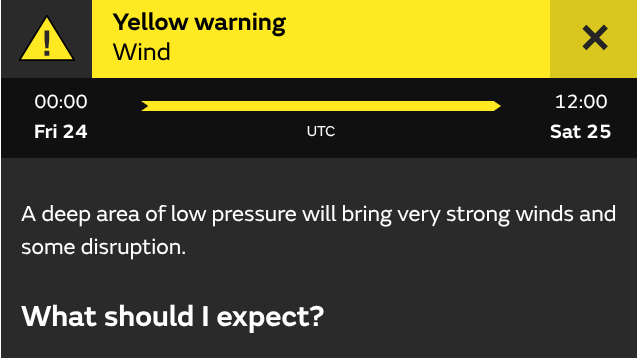
The accompanying text covers what, when, where, and looks at confidence.
This is the NSWWS, the official National Severe Weather Warning Service but it is not just for the general public. It is designed to inform businesses, emergency responders and governments. Trying to fit with all of these different users can inhibit the effectiveness of the warning system.
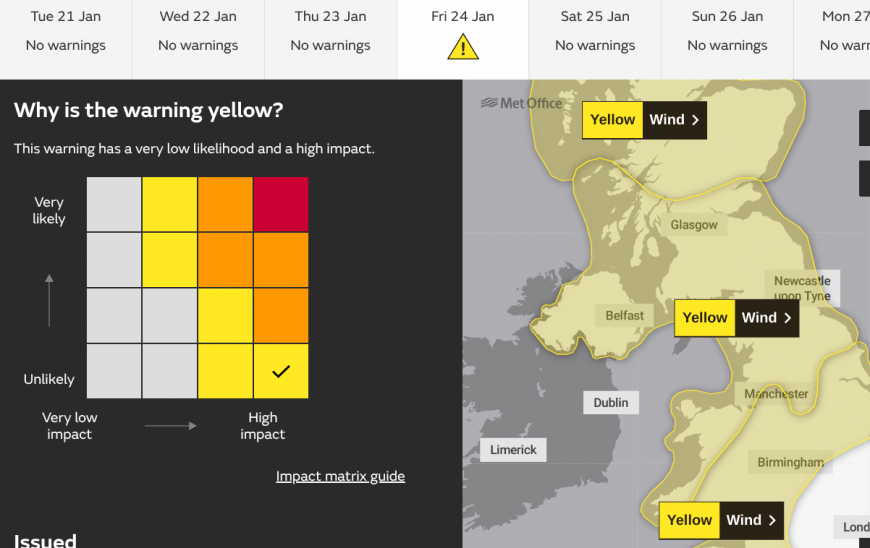
When there isn’t any severe weather forecast, the level is green and the warnings page displays “No Warnings”. If a day does have warnings, the highest colour will be displayed as a triangle. Many countries across Europe have adopted this yellow, amber, red system but some, like France, have an extreme violet/purple level too.
Meteo Alarm where weather warnings from many European national weather services can be viewed.
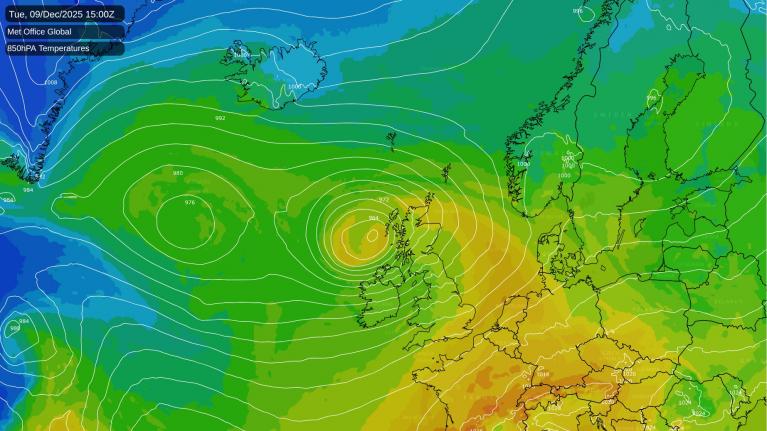
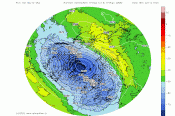
As an early heads-up type warning a yellow warning may appear several days ahead. Confidence at this stage may be low, of say the track of a deepening Atlantic low pressure or areas likely to see snow. However, people should note that there is the potential in the forecast for impactful weather conditions in the days ahead. As the forecast certainty increases as the event nears, then the warning levels can increase, say up to Amber. A red warning is rare and would not usually be issued more than a day or two in advance
At other times, warnings are more urgent or get upgraded as the weather actually deteriorates.
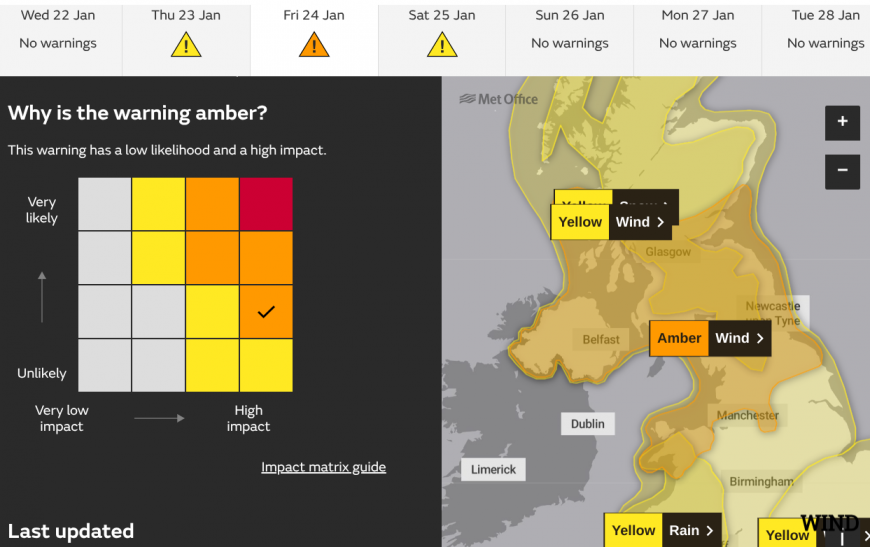
The Matrix
This tool tries to explain how the forecast certainty matches with the severe weather/time of day/location/season/existing conditions etc, the potential impacts. If severe weather is going to occur in the middle of the night, there will be fewer people about. If heavy snow is forecast on a Friday before Christmas, then many people could be impacted. Winds of 40mph for the Western Isles are more common than for central London.
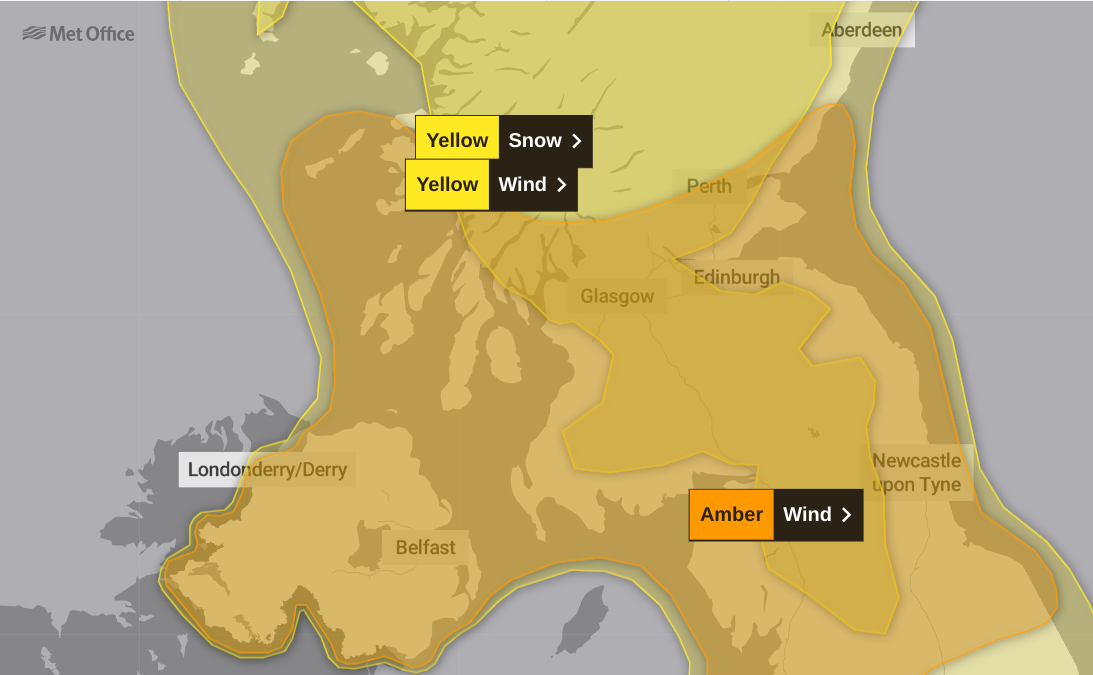
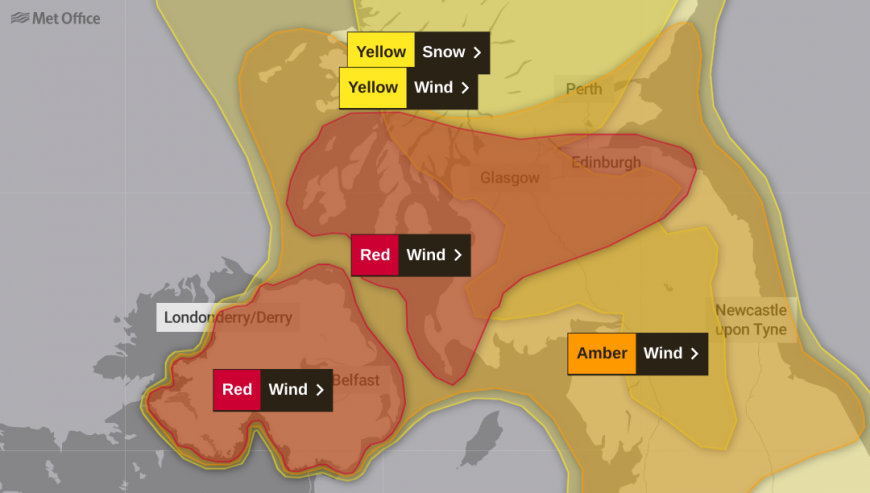
You may see layers of warnings on the map. An amber wind warning with longer running yellow wind warning underneath. This might show an intense core of gales and high gusts within a storm but a longer spell of very windy weather. These warnings cover wide areas with different terrain and topography. You may live near a river, or on an exposed hillside, there could be a spring tide coming that day. The colour of the warning gives a broad idea.
These levels of impacts; very low, low, medium and high, are all listed on the Met Office website with suggestions of the types of disruption and damage that could occur from each weather type.
They include phrases such as Prolonged or Short-Lived, Localised or Widespread
“Localised: there will be a few instances of the impact across the warning area. Widespread: impacts are expected to be experienced across much of the warning area.”
Once the warning level reaches Amber, disruption is more likely. People should be looking to change plans and take action to prepare and protect.
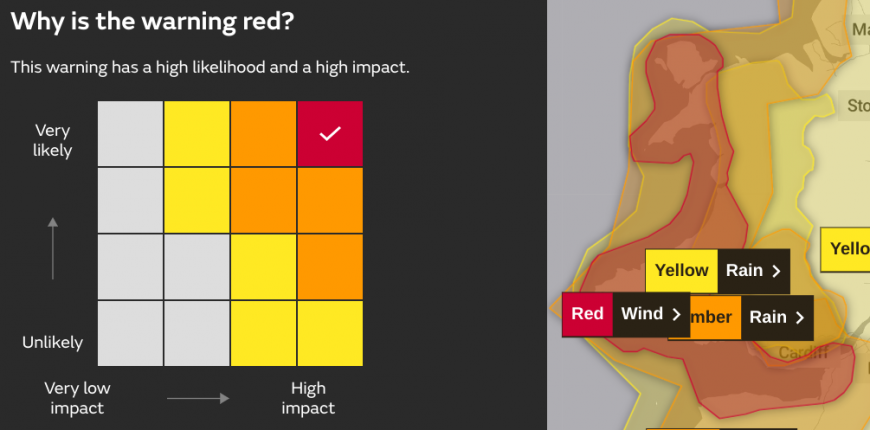
Red warnings are rare and “reserved for very dangerous weather with a high level of certainty”. Essentially people should stay indoors (if that is safe) as a risk to life is highlighted. Thinking about events such as Storm Arwen and Storm Eunice, substantial disruption to travel and infrastructure can occur. In Storm Darragh, the UK government's Emergency text alerts system was used for the first time to warn people in Wales about dangerous winds along with the red warning.
Difficulties for public decision-making seem to arise in Amber warning situations. Red is pretty clear cut, don’t go out. Yellow warnings are seen fairly often and can sometimes highlight seasonal bad weather or ongoing severe weather that the public will already be aware of from the day/s before. With yellow and amber warnings there might be the perception that it’s not as bad as (the next level up) an amber or a red. The warnings are there for you to make decisions. An amber warning tells you that there is “the possibility of travel delays, road and rail closures, power cuts and the potential risk to life and property.” It’s the time to prepare and protect, not take chances.
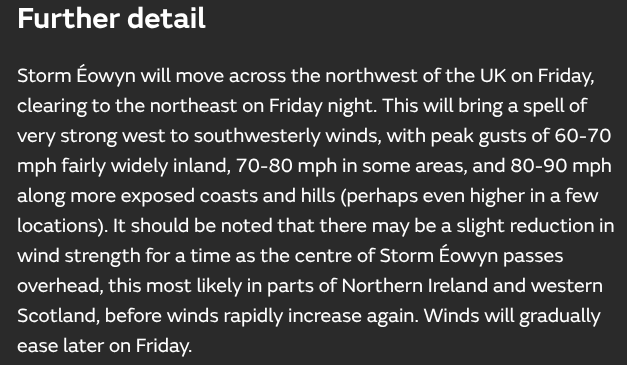
Read the Further Detail section in the accompanying text, look at the wider picture of rain radar, observations, and local news. Don’t just follow the guy in front and don’t just put out the recycling and hope for the best. Think about your local area or enquire if you are visiting somewhere new and prepare for delays if travelling. People do end up stuck in their cars overnight in midwinter. In times of heavy rain, look at the Environment Agency warnings as well, they work together with the Met Office. Warnings do save lives.
Loading recent activity...