In my last article entitled “Variable British Weather: Is Something Up?”, we had a quick look at the evidence that extremes were increasing in the mid-latitudes, what the main driver of this increase likely is (altered jet stream) and the main mechanisms by which Arctic Amplification interact with the jet stream. It will be useful to have some of this info in the back of your mind going forward, so if you haven’t read it, here is the link.
The type of mechanism at play can vary in spring and summer compared to autumn and winter. As such, given that winter is here, this article will explore how these processes are believed to operate in winter in more detail, such as the links with the stratosphere, sea ice, snow and more. We’ll finish off by taking a quick glance at where we might find these features in the observations and model output right now.
(Northern Hemisphere Jet Stream Animation)
One of the most robust theories about how Arctic Amplification is influencing our weather in winter comes down to changes in the thickness of the polar atmosphere brought about by warming (remember, warming air causes it to expand, making the atmosphere thicker). Arctic air temperatures have been increasing at a much faster rate in autumn and winter than in the other seasons. One of the main reasons for this is the diminishing summer sea ice cover. Removing sea ice (which is often covered in snow) and replacing it with open water, is effectively removing a highly reflective surface and replacing it with a highly absorbent one.
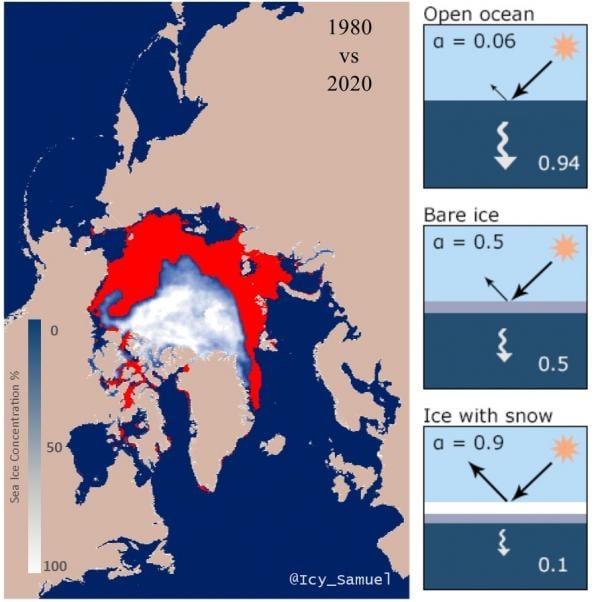 (The difference in the minimum sea ice extent between 2020 and 1980 (left) and the changes in reflectivity from open ocean to snow covered ice on the right (from the NSIDC)
During the long daylight hours of polar summers, the open water absorbs increasing amounts of heat. By the time the midnight sun sets, this heat is released into the atmosphere, causing massive air temperature anomalies across the Arctic, which extend high into the atmosphere, increasing geopotential heights (thickening the atmosphere).
(Animation depicting the trends in Siberian Arctic temperatures in October. Source: Twitter - @icy_samuel)
The atmospheric warming and thickening are theorised to have important implications across a range of scales. Firstly, by thickening the Arctic atmosphere, the thickness gradient from the mid-latitudes to the Arctic is reduced. The jet stream relies on this gradient and so making it more shallow might slow the jet stream down (remember the comparison with stages of a river in the last article). This means that the Rossby waves (the large troughs and ridges in the jet stream) move around the planet more slowly, producing more persistent weather patterns. Secondly, the increased thickness may also allow the large Rossby wave ridges to extend further into the Arctic, increasing their amplitude. As the troughs move further south and the ridges further north, anomalous air masses get pulled into these regions, providing yet another mechanism that contributes further to the occurrence of extreme weather events.
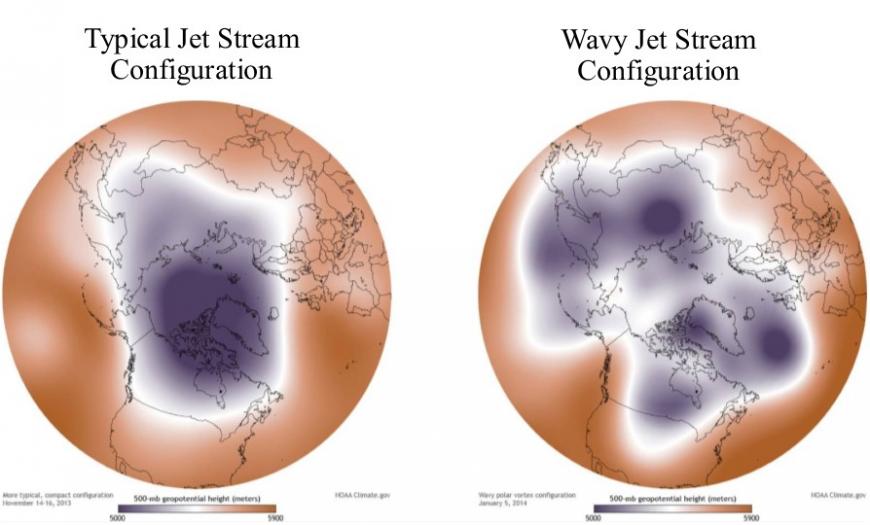 (A typical jet stream configuration on the left with large Rossby waves and a disturbed jet stream on the right with multiple ridges and troughs bringing cold air south and warm air north. Image adapted from: http://dx.doi.org/10.5065/D6TH8KGW)
The influence of the stratosphere on our weather has gained a lot of attention in the last two decades. Disruption of the stratospheric polar vortex, such as from a Sudden Stratospheric Warming (SSW), can cause drastic changes to the jet stream, allowing cold Arctic air it to spill southward bringing freezing conditions to parts of the mid-latitudes. Several of the major cold spells in the UK resulted, at least in part, from disruption of the polar vortex – the “beast from the east” in 2018 being a rather prominent, recent example. That being said, it may be difficult to envisage how changes at the surface of the Arctic could influence the atmosphere 10s of kilometres high. Thankfully, numerous studies in the last decade have begun to unravel this mystery and so I’ll try to take you through step by step.
Starting at the surface, there are numerous regions that are important. For now, I’ll focus on one of the key areas, the Barents and Kara Seas. This region has undergone the most intense Atlantification in the Arctic, a process whereby the warmer, saltier waters of the Atlantic Ocean are more frequently encroaching, reducing the amount of sea ice present. As such, these regions have seen some of the largest changes in sea ice cover in recent decades, with much of the Barents Sea now free of ice even in mid-winter.
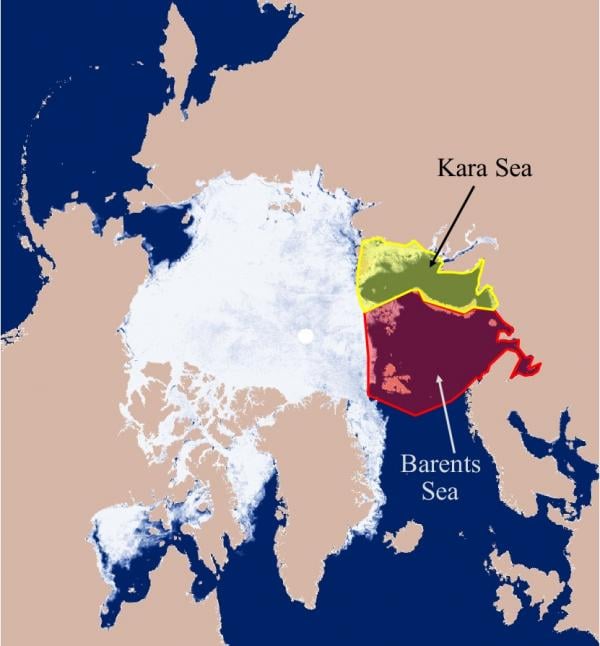 (Sea ice concentration map from late November showing the locations of the Kara and Barents Seas.)
The lack of ice has resulted in significant surface air temperature anomalies in this region. And, as we’ve discussed, this also causes the air mass to grow vertically, increasing the geopotential heights – with some far-reaching consequences.
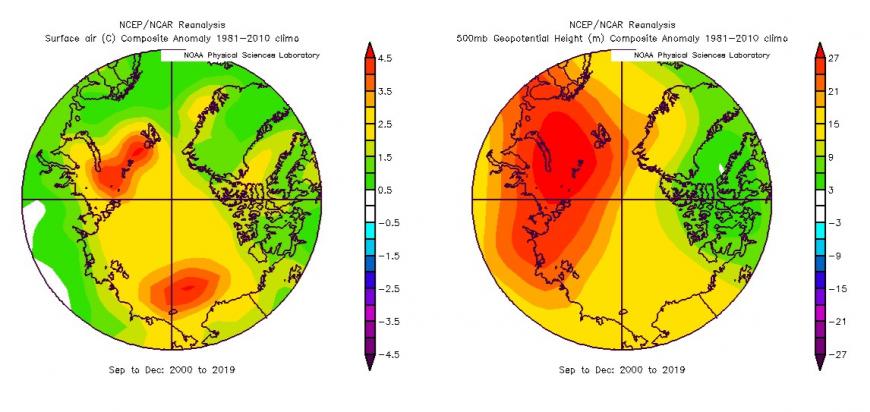 (September to December 2000 to 2019 surface air temperature anomalies (left) and 500hPa geopotential height anomalies (right))
When a jet stream ridge reaches eastern Europe/western Russia, the added atmospheric thickness in the Barents/Kara region can amplify it. The amplified ridge creates a stronger high-pressure system to its east. In this case, it promotes a stronger Siberian high pressure, pulling colder air south and enhancing snowfall.
Secondly, the amplification also slows down eastward progression of the Rossby waves, encouraging blocking high pressure around the Ural Mountains, otherwise known as Ural Blocking. This is where we come back to the stratosphere! This Ural Blocking is positioned in such a way that when the eastward moving Rossby waves encounter the block, the waves can break. This results in energy being driven both poleward (towards the Arctic) and vertically into the stratosphere. Picture it like a wave breaking against a cliff, with water shooting vertically and horizontally. The net result being disruption of the Arctic stratospheric vortex. A reduction or reversal of the dominant westerly winds then occurs, which can propagate down through the atmosphere, disrupting weather patterns at the surface and allowing cold air to spill south out of the Arctic.
(February 2018 SSW. Note the massive change in temperature across the central Arctic stratosphere, from around -70°C up to -30°C. Source: Stratusdeck)
Overall, we can summarise the interaction with the stratosphere as follows: A loss of sea ice in the Barents/Kara region → increased surface temperatures → Increased atmospheric thickness → Interaction with the jet stream → Formation of Ural Blocking → Energy transfer to the stratosphere → Disruption of the stratospheric vortex → Happy snow lovers!
Unfortunately, even with a massive SSW and a breaking apart of the vortex, the cold can spill south to any number of location, making it hit and miss. So it won’t always put a smile on the face of snow and cold lovers everywhere.
At the beginning I mentioned that we might be able to see some of these features now, and in the model output. Luckily, 2020 is shaping up with some good examples. So, what features might we want to look out for?
1. The combined sea ice extent in the Kara and Barents seas is currently the lowest on record. So that’s the first box ticked ✔
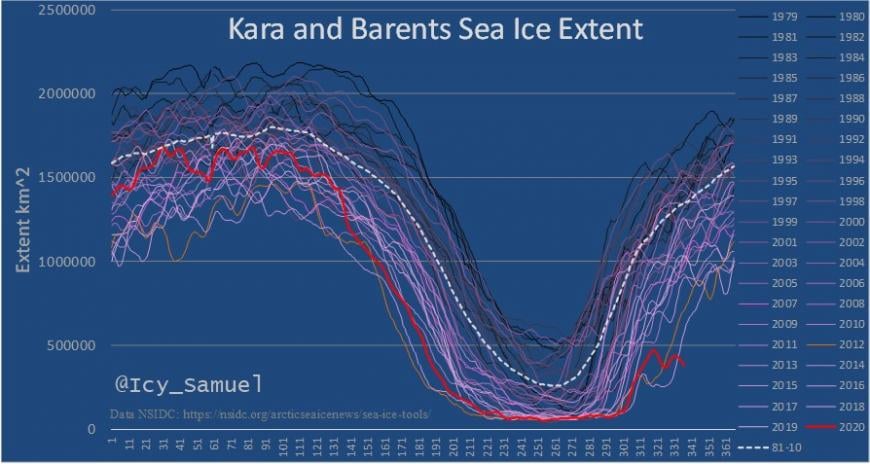 (Combined sea ice extent for the Kara and Barents Seas.)
2. Air temperature anomalies have remained staggeringly high across the Arctic this autumn, including the Barents/Kara region, and have continued into December. Box 2 ✔✔
(Northern hemisphere temperature anomalies at the start of winter.
3. Snow cover in Siberia has been greater than normal in October and November, especially in southern Siberia. ✔✔✔
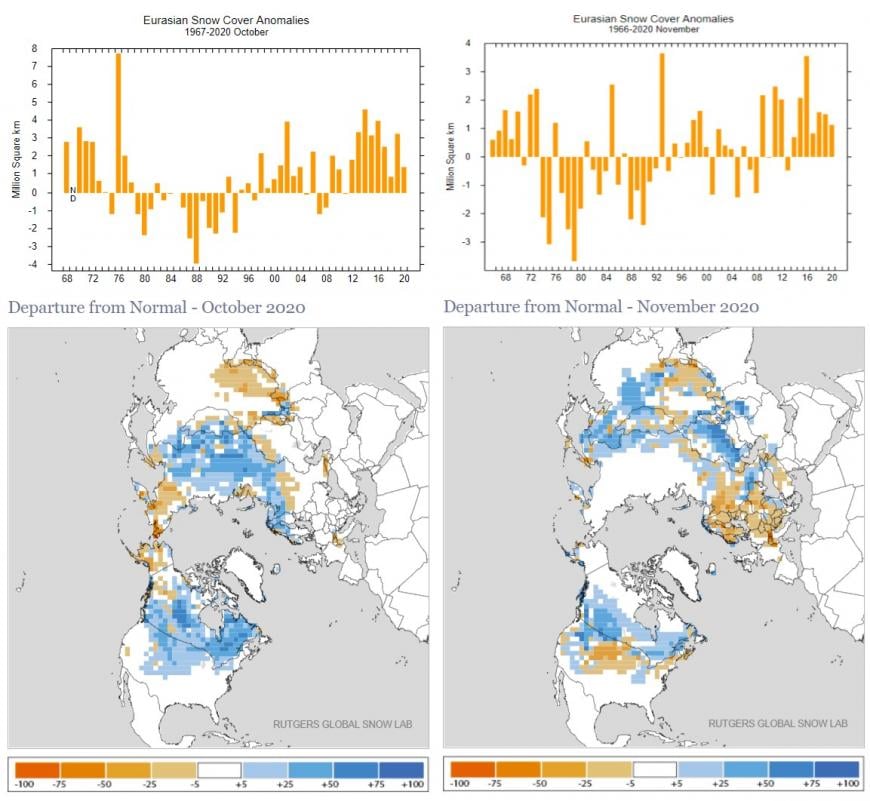 (Snow cover in October and November have been above average for Eurasia as a whole, but especially in southern Russia. Data from Rutgers snow lab)
4. Ural blocking is increasing and forecast to continue doing so in December. As the 10 day mean SLP chart shows. That’s 4 out of 5 so far. ✔✔✔✔
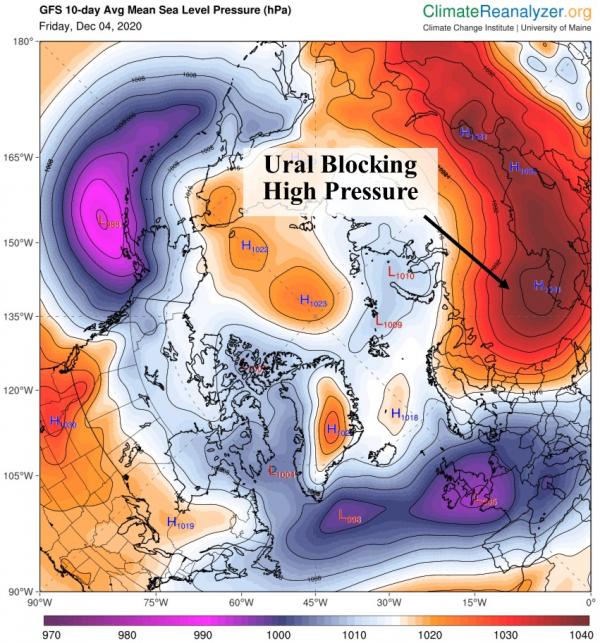 (10 day mean forecast of sea level pressure depicting a persistent high pressure around the Ural Mountains.)
5. Stratospheric effects.
The ingredients appear to be in place to disrupt the stratospheric polar vortex. Indeed, the ECM predicts a weakening of the 10hPa zonal winds (a measure the strength of the stratospheric westerly winds associated with the vortex). Several of the experts on the topic are also talking up the potential of disruption through December and beyond. You can follow the hype in the stratosphere and polar vortex thread in the netweather forum! That’s all 5 boxes ✔✔✔✔✔
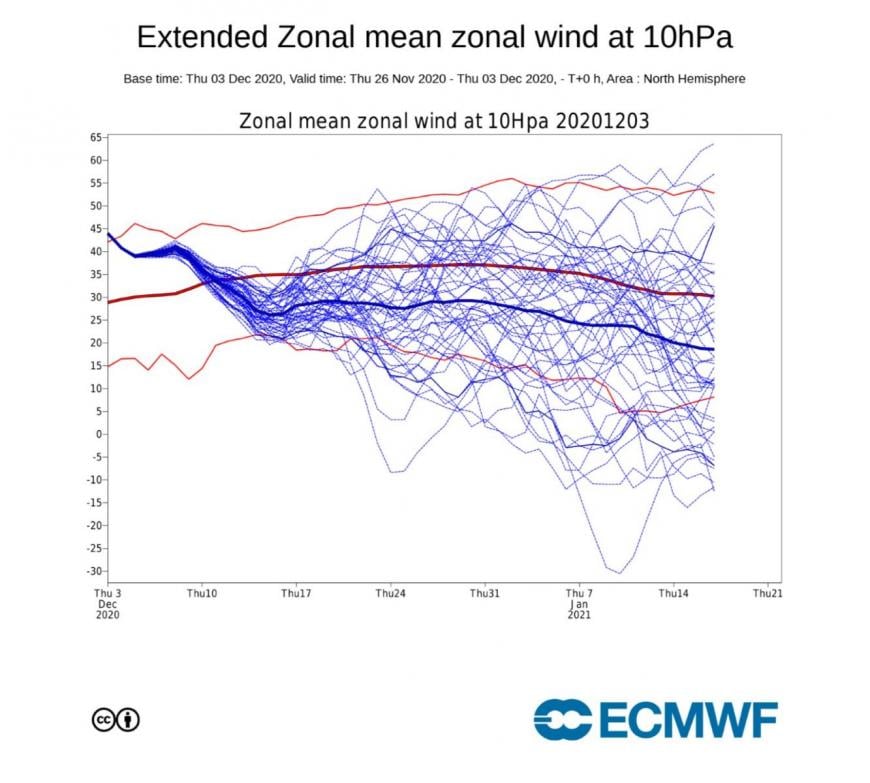 (Forecast 10hPa zonal winds from the ECM. The thin blue lines are the individual ensemble values, thick blue is the mean. A progressive weakening during December is forecast, with lots of variations possible into the new year)
This is a quick look at how changes in the Arctic can influence our weather in winter, and potentially contribute to more extremes in the mid-latitudes. There are other mechanisms that are believed to play a role, and you can read up on these and more in the reading list provided below. However, it’s best to keep in mind how intricately interconnected so many parts of the atmosphere and surface are, and how chaotic it can all appear – throw in ENSO, the QBO, solar activity or any other number of factors, and attempts to isolate and verify the mechanisms described here become exceedingly difficult. Indeed, several researchers suggest that the processes described here and elsewhere don’t really have an influence and that connections/correlations are being found in the noise that don’t exist in reality. This opinion appears to be in the minority, but may well turn out correct.
The reality is that the changes in the Arctic have only really become substantial in the last 2 decades, which isn’t much time for verifying its influence in such a chaotic and variable system. That being said, this is often how new discoveries are made. Theories are proposed, evidence is gathered, and the strongest survive. This is a fascinating time, with mountains of data available and opportunities to discover new relationships between different elements of the Earth system and how our rapidly changing climate is affecting it all. Expect more to come!
An overview of the current debate and theories on how Arctic Amplification is altering mid-latitude weather patterns. Links to most of the studies and other proposed mechanisms are contained within these:
1: Nature.com
2: OpenSky
3: Key Paper linking Arctic Amplification to extreme mid-latitude weather:
4: Paper disagreeing with the proposed Arctic – mid-latitude links:
Loading recent activity...