
The start of the month likely to see an unsettled and sometimes windy theme, with areas of low pressure moving west to east off the Atlantic, this theme could last through to mid-month at least and perhaps well into the second half, though there is a signal that high pressure may more likely build at times in the second half, leading to some warmer drier for some or all parts. There is potential for one or two deep lows that become named storms, as areas of low pressure moving in off the Atlantic may have the remnants of tropical storms or hurricanes which interact with an active / strong jet stream.
Temperatures overall for the month likely to be around the long-term 1991-2020 average, though could be slightly below in the first half before recovering above average in the second half. Rainfall likely to be around average overall, though perhaps above average in the west.
There are indications of a greater probability, for now, of blocking high pressure to build sometime through October - bringing more settled and fine weather for one or perhaps two weeks for large parts of the country, possibly bringing an Indian Summer, though any warmth will depend on how any blocking anticyclone positions. Generally, temperatures above average with some warm days but also some seasonally cool to chilly nights. Perhaps one or two generally brief periods of unsettled conditions, as troughing / low pressure returns from the west at times.
Temperatures likely to be above the 1991-2020 long-term average. Rainfall more likely to be below average for the whole month, though with some regional exceptions, with perhaps average rainfall towards the south and west.
As polar regions continue to cool and the polar vortex strengthens and expands south, expect unsettled spells, perhaps with occasional Atlantic storminess to affect the UK, with, wet and windy weather at times in the month, but also there is an indication for a tendency for high pressure to build to the west at times, as troughing / low pressure retreats to the east or northeast, bringing cooler northerly or northwesterly flows with a risk of frost and wintriness to higher ground later in the month. But we think there will be one or two vigorous Atlantic storms during the month moving west to east.
Temperatures likely to be above the 1991-2020 long term average for the whole month, rainfall around average too.
Continue below for the in depth forecast and explanation of the factors which are expected to influence the weather this Autumn.
It’s hard every year to contemplate that summer is nearly over and that we are on the downhill slope towards winter. But meteorological autumn is nearly upon us. Sometimes, though, September can be an extension of summer, as we saw last year. So can we expect late summer weather and how wet and cold will it be later in the autumn? In this autumn forecast we tell you what we already know about autumn 2025.
There are many factors, conditions in the atmosphere and ocean, around the globe, that affect our weather several months into the future, and it is always difficult to know which factors will be the controlling ones. The calculated long-term forecasts must therefore always be interpreted as a best guess for the weather in the coming time. In addition, the long-term meteorologist also assesses how other conditions around the globe can affect the weather at our latitudes. It is not always that the forecasts catch these signals in time.
To get an idea of what kind of autumn it will be, we will focus on the weather model seasonal forecasts, the potential for a developing La Nina, Atlantic SSTs, the Indian Ocean Dipole the Madden Julian Oscillation, North Atlantic hurricane season and analog years with similar ENSO, etc.
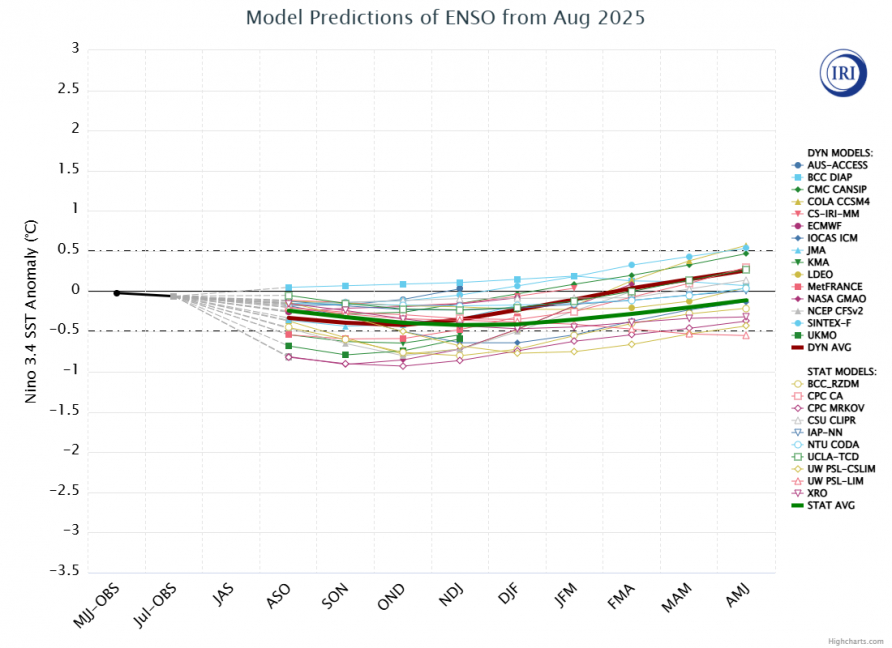
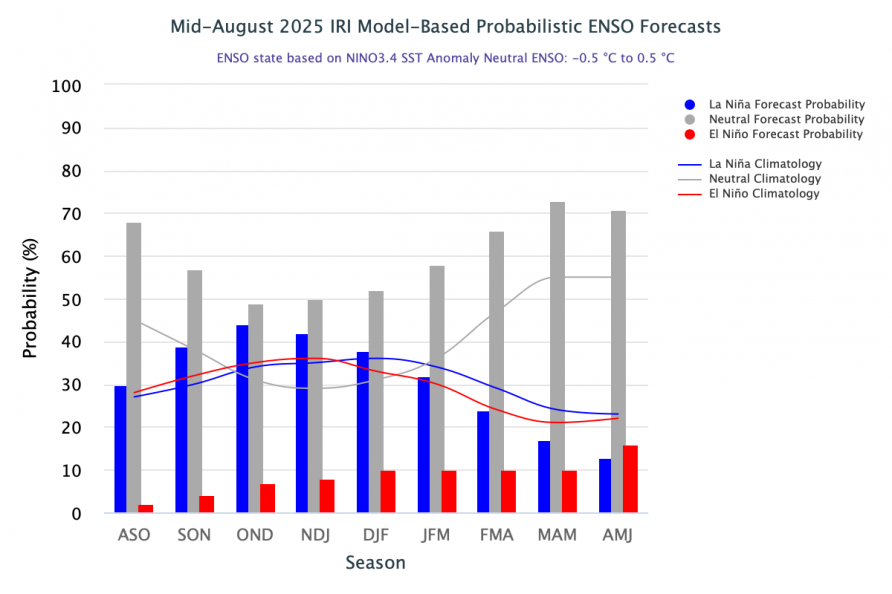
A La Niña Watch has been issued by the U.S. Climate Prediction Center (CPC). There is a 50-55% chance of La Niña conditions developing this fall and continuing through the winter.
A La Niña occurs when water temperatures in the central and eastern tropical Pacific are at least 0.5°C cooler than normal for several consecutive months, while an El Niño unfolds during an equivalent episode of warmer-than-normal water temperatures.
Sea surface temperatures in a key region of the eastern equatorial Pacific Ocean are currently hovering around normal, a sign that we’re in ENSO-Neutral conditions with neither El Niño nor La Niña present.
The latest update from CPC called for ENSO-Neutral conditions to continue through the remainder of summer. By this autumn, though, water temperatures are expected to cool just enough to qualify as a relatively weak and short-lived La Niña event.
However, it is important to remember that although the influence of La Nina extends beyond the areas around the equator, the influence on the weather during autumn in our country is limited.
There is more of a connection between La Niña and the weather in our winter or spring. In a La Niña autumn, more hurricanes are often active in the Atlantic Ocean, which makes the weather forecast for the UK extra uncertain. We may have to deal with remnants reaching Europe more often. Depending on the track of these remnants, this gives us either warm and sunny weather if they track way north over the Atlantic or stormy and cool weather if they track directly at UK. However, La Nina isn’t imminent, but there is potential for one to develop this autumn, so its effects on global weather patterns may not manifest until late autumn at the earliest. And, while every La Niña is different, and not all La Niña winters behave the same way.
There are myriad factors that work together to result in the weather we experience -- La Niña is just one of them.
Later on in this forecast we will look at composites of autumn months that features ENSO neutral in summer heading into weak La Nina territory.
Seasonal forecasts are correct about 60% of the time and the forecast for one month ahead is of course more reliable than for the third month. It is also important to realise that seasonal models purely outline a rough trend for monthly average air pressure, temperature and precipitation. Even an averagely warm month can easily have a cool week and vice versa.
Monthly and seasonal forecasts for autumn and spring tend to be reliable less often than those for summer and winter. This is because the predictability of the atmosphere is smaller in the transitional seasons, where cold and heat often alternate. Ex-hurricanes in the autumn can also make the forecast extra uncertain.
The following models will be considered for their seasonal output: ECMWF (European Centre for Medium-Range Weather Forecasts), CFS (Climate Forecast System, NOAA), UKMO (Met Office, UK).
Long-term seasonal weather forecasts are not comparable to short-term forecasts, which often provide a temporal and spatial association of weather patterns. Long-term weather forecasts look for signals about the direction temperature, pressure and precipitation might take. However, even with clear signals, there is still an uncertain probability of occurrence.
Seasonal weather models indicate that September, October, and November could be warmer than the long-term average. Above-average temperatures and rather dry conditions are forecast for September - a trend that poses challenges for nature and agriculture following an exceptionally dry spring and summer for large parts of the UK.
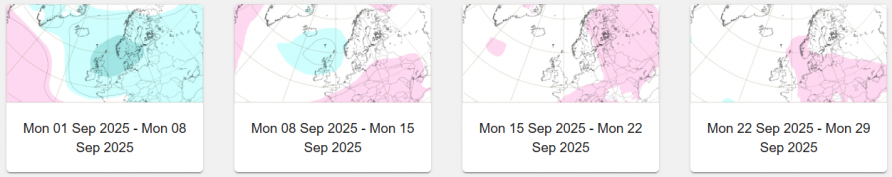
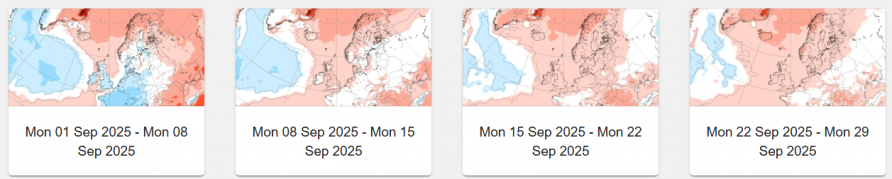
The most recent ECMWF sub-seasonal weeklies forecast which goes out 46 days ahead, suggests lower pressure near or over the UK during the first half of September, though towards a neutral signal thereafter, with signs of pressure rising to the south and east later in the month. So more changeable conditions for all in contrast to a dry and settled August, but with rainfall greater towards the north and west. Temperatures generally around the average.
With regards to this model’s current seasonal output, this may change in the September update, but we will only use the predictions for October and November, as with other models, as the EC weeklies can give a more reliable outlook.
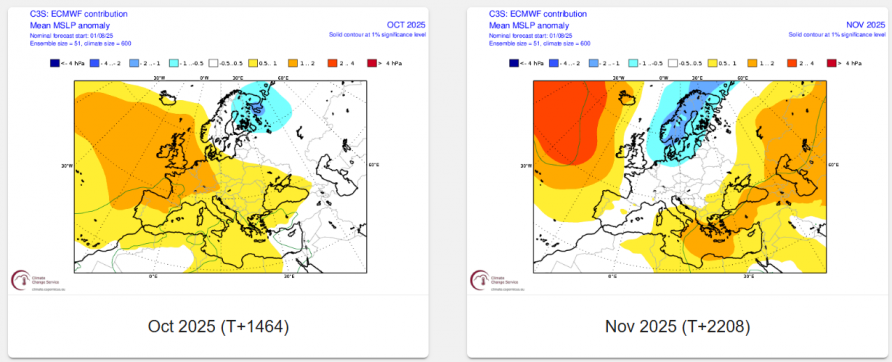
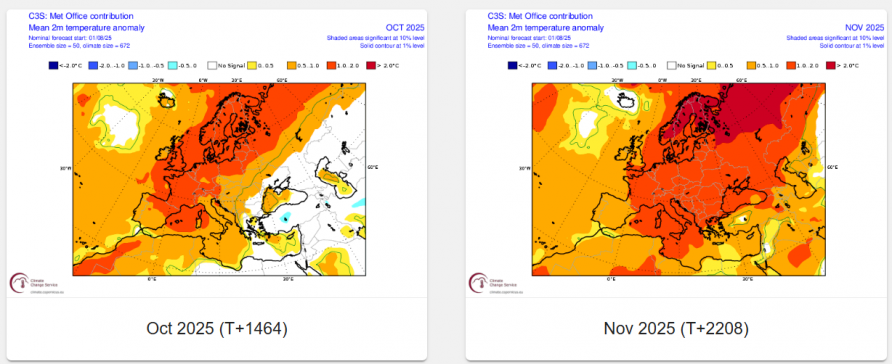
October features a high pressure anomaly over NW Europe & NE Atlantic. November features strong high pressure anomaly to the west of NW Europe, low pressure anomaly over Scandinavia. Temperature-wise, above average both months.
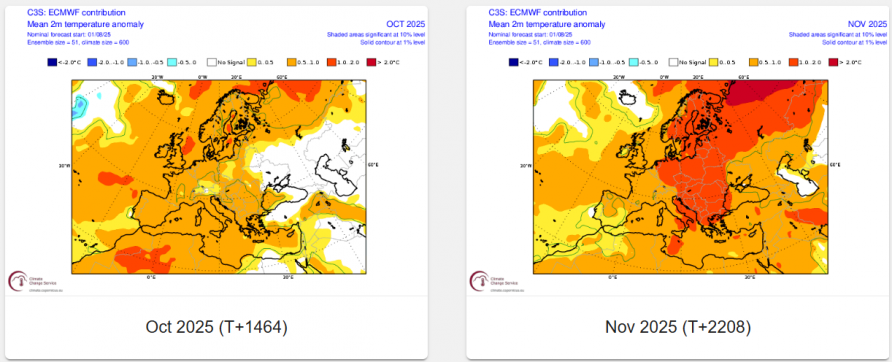
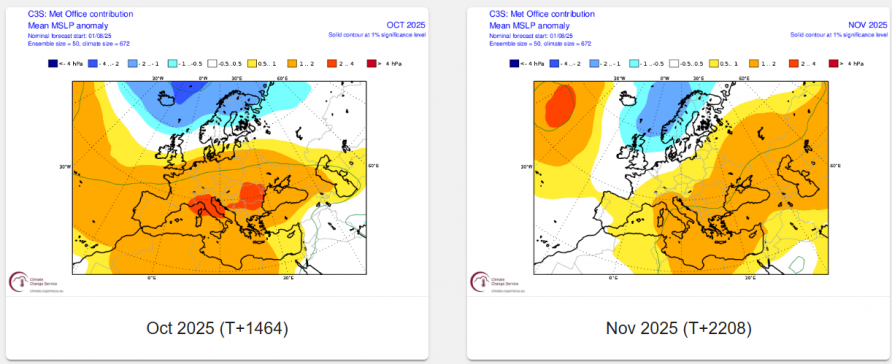
For October, strong low pressure anomaly toward Iceland, high pressure over mainland Europe. For November, low pressure anomaly north of Scotland over Norwegian Sea, high pressure over NW Atlantic and SE Europe. Temperatures above average both months, widely 1-2C above in October, 0.5-1C in November.
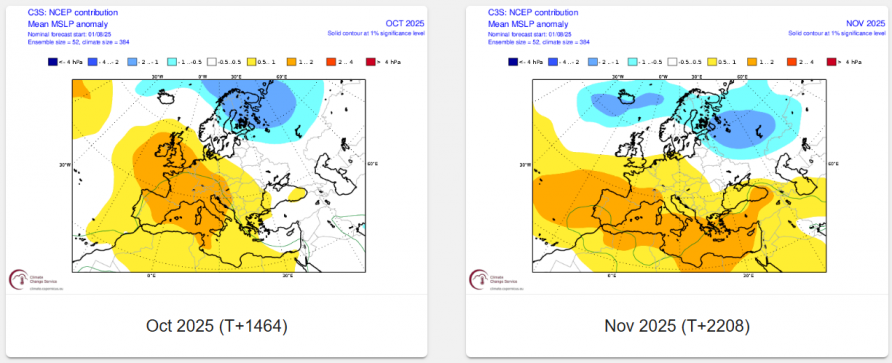
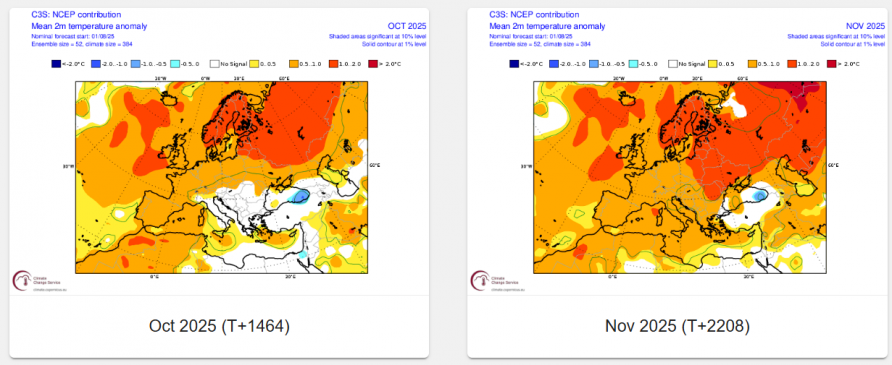
October, like ECMWF and Met Office, high pressure anomaly over UK and also much of western Europe. November, low pressure anomaly towards Iceland and Scandinavia / NW Russia, high pressure anomaly towards southern Europe. Temperatures both months 0.5-1C above average.
Both ECMWF and NCEP suggest a high-pressure anomaly for October, suggesting periods of high pressure dominating likely, suggesting periods of dry and settled. UKMO more typical autumn westerly flow, so unsettled at times. All models show above average temperatures both October and November. Drawing conclusions from all three models above, September based on ECMWF sub-seasonal suggest September may be unsettled in the first half, maybe longer, likely due to energy from the remnants of Hurricane Erin and further tropical storms causing a strong stream for a time, perhaps a drier more settled end. A signal for high pressure to dominate large periods in October, but with unsettled spells. November often unsettled, with low pressure anomaly close to the north or northeast, but with scope for pressure rises to the west. Temperatures look close to average for September from the ECMWF sub-seasonal, above average from all three seasonal model forecast for October and November.
But as always, it may not be so clear-cut, with other drivers also at play - such as the MJO, ex-tropical storms and Atlantic SSTs, with more short-term variations likely as some other drivers of our weather will also play their part. The Atlantic hurricane season, after a quiet start, is picking up with Hurricane Erin and further tropical disturbances moving west potentially becoming hurricanes and recurving northeast over the North Atlantic towards Europe like Erin, based on sub-tropical Atlantic high forecasts, through September. Also, October, especially early on, can feature ex-hurricanes, which may skew the high pressure outlook or enhance it. Also, it is worth taking into consideration the impacts of the MJO (Madden Julian Oscillation), who’s cycles can affect weather patterns across the globe too, but can only be predicted up to a month ahead at the most. I will also take-a-look at analogs of previous autumn months with similar global patterns, particularly those with developing weak La Nina conditions present.
Significant anomalous warmth was observed in the North Atlantic during spring 2025, with a prolonged marine heatwave affecting the waters around the UK and Ireland. Record-high sea surface temperatures were observed, reaching up to 4°C above normal in some areas by mid-May. This heatwave began in March and was driven by persistent high-pressure systems causing calm, sunny, and dry weather, allowing heat to accumulate in the upper ocean. This followed above-average sea surface temperatures during the preceding winter.
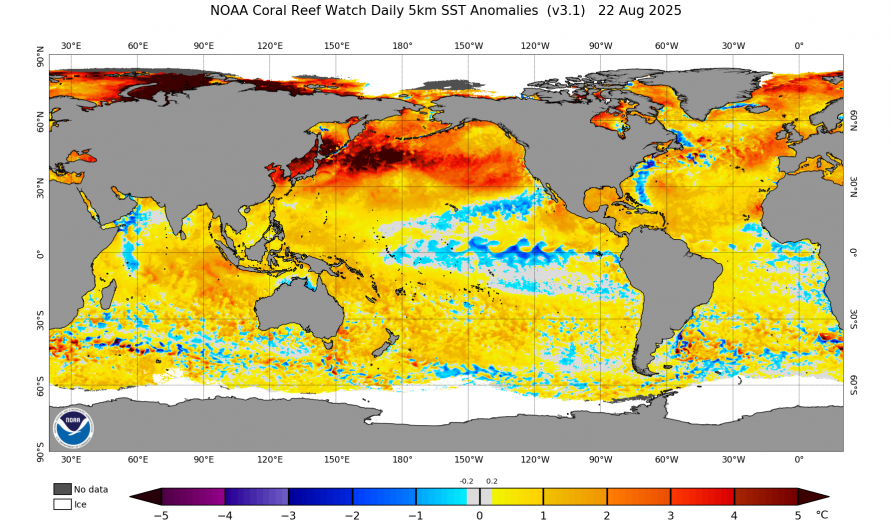
Sea surface temperatures have continued anomalously warm around the UK and Ireland through summer, thanks to the persistence of high pressure extending from the Azores - bringing persistently warm or hot days and warm nights. This anomalous warmth in the seas around NW Europe and upwind over the Atlantic will likely, we think, contribute to above average temperatures through autumn.
A marine heatwave is also ongoing to the north of the UK over the Norwegian Sea, which may moderate flows from the arctic over the next few months, so northerly flows likely not as cold as they could be.
The IOD has only been recognised for about 20 years, making it much less studied than many other climate patterns, including ENSO. The IOD is a mode of climate variability over the Indian Ocean, independent of ENSO (El Niño/La Niña). It is characterised by sea surface temperature (SST) anomalies and associated convective anomalies with opposite signs in the eastern and western tropical Indian Ocean. In the positive IOD phase, lower-than-normal SSTs and suppressed convective activity are seen in the southeastern part of the tropical Indian ocean, while SSTs in the western part of the ocean are higher-than-normal with accompanying enhanced convection. Negative IOD events have anomalies with signs opposite to those of its positive phase.
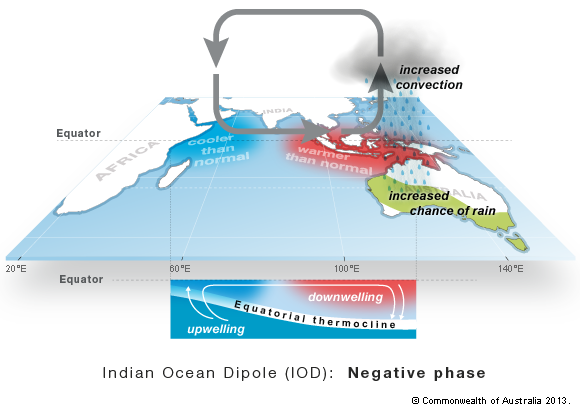
The IOD has recently turned negative and is forecast to turn increasingly negative. Strongly negative IODs have have not occurred that frequently over the years. Since 1960 there have been 8 moderate to strong negative IOD years between 1960 and 2023. They are: 1960, 1992, 1996, 1998, 2010, 2016, 2021, 2022.
This negative IOD pattern is consistent with La Niña (negative phase of ENSO), as the IOD generally moves in sympathy with the phase of the El Niño Southern Oscillation (ENSO) and the Southern Oscillation Index (SOI), but there are occasions when it doesn’t behave quite as expected.
The impacts of IOD are felt in the tropics and weather patterns across much of the mid-latitudes, including North America and Europe. Like the El Niño and La Niña, the Indian Ocean dipole impacts the preferred regions of ascending and descending air in the Indian tropical ocean. The phase of the IOD contributes to determining important aspects of local and global climates. Although its impacts on global weather patterns are more marked in winter, there will likely be some influence on patterns, along with other drivers, such as ENSO, on patterns this autumn too.
The IOD is generally well predicted by dynamical modelling, and thus, we can usually be confident that it will likely remain negative through the coming months.
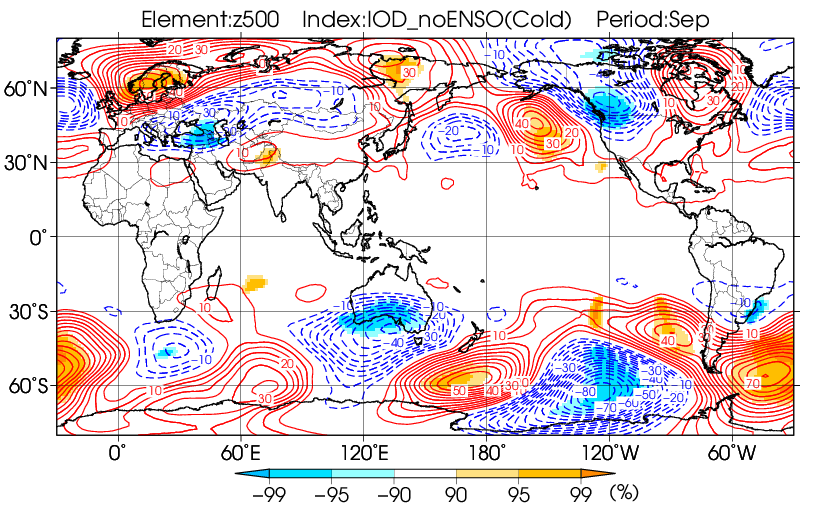
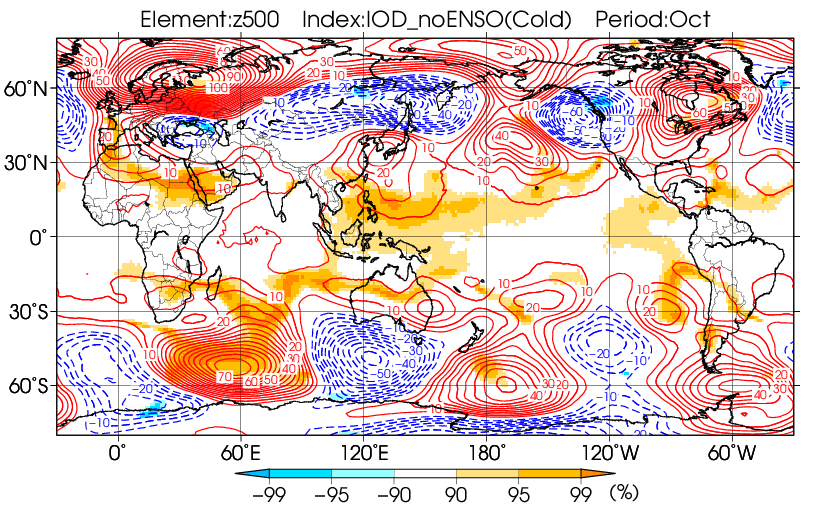
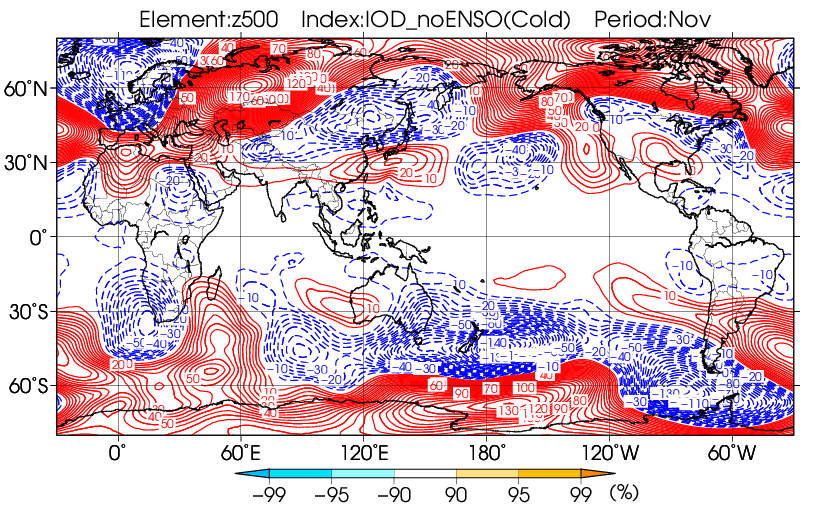
Composite map for negative Indian Ocean Dipole events, mentioned above, during all three autumn months are shown below and will be taken in consideration when making this autumn forecast.
After a relatively quiet start to the Atlantic hurricane season, Erin became the first hurricane of the year in the Atlantic basin on the 15th of August and rapidly intensified into a major Category 5 storm the following day. This intensification is one of the fastest on record.
The Atlantic hurricane season runs from June 1 through November 30, with the peak of the Atlantic hurricane season in September, so obviously forecasts of how active the hurricane season may end up will be taken into account.
NOAA issued its updated Atlantic hurricane season outlook on the 7th of August and its prediction for an above-normal season remains on track. They said the likelihood of above-normal activity is 50%, a 35% chance of a near-normal season, and a 15% chance of a below-normal season.
The tropical Atlantic is looking rather busy at the moment. Even though Hurricane Erin is now an extratropical depression moving over the North Atlantic towards Ireland, the US National Hurricane Center is now monitoring Invests 90L and 99L for tropical development.
From the CPC Weeks 2-3 Global Tropical Hazards Outlook (GTH) issued 19th August: “During Week-1, the National Hurricane Center is monitoring a disturbance over the central Atlantic that has a moderate potential for development over the next several days. Should this system develop, it would be located somewhere over the western portion of the Atlantic basin at the start of the Week-2 outlook period. Following this system, environmental conditions are forecast to become somewhat unfavorable for additional tropical cyclogenesis across the Atlantic MDR for several days to a week. Additional easterly waves are forecast to emerge over the basin from Africa towards the end of Week-2. A 20-percent chance of formation is included in the Week-2 outlook in the vicinity of the Cabo Verde Islands should tropical cyclogenesis occur on the fast side of the guidance. During Week-3, more favorable conditions are anticipated to develop across the basin, and a broader region for potential formation is indicated. Dynamical models indicate a potential for formation across the western Caribbean or Gulf of Mexico during Week-3 as well, with low-level westerly winds favored to build across the region.Mexico during Week-3 as well, with low-level westerly winds favored to build across the region.”
Hurricane Erin recurved north then northeast over the Atlantic towards Europe and current medium range models suggest further tropical cyclones may do the same - recurving towards Europe / NE Atlantic as they become extratropical.
With the remnants of Erin invigorating a zonal jet stream towards Europe as we end August enter September, and further extratropical cyclones being picked up by the jet stream, unsettled low pressure dominated weather may be present during the first few weeks before tailing off - as the tropical Atlantic becomes quieter again. Hurricane activity may pick up again, but could be directed further west over the Atlantic and over Gulf of Mexico region, so less likely to affect European weather patterns.
Although the MJO is a wave of enhanced convection that circum-navigates the global tropics, it does impact the upper patterns at higher latitudes of the northern hemisphere, so can be a useful tool to use for predictions for 3-4 weeks ahead, but no more than that really.
An active MJO event crossing the eastern Indian Ocean is coming to an end. Most of the dynamical model MJO index forecasts suggests a rapid weakening of the RMM index's amplitude, followed by a renewed signal over the Indian Ocean into early September. Time-longitude forecast plots of various atmospheric fields suggest that the broad-scale MJO envelope may disassemble into faster moving Kelvin waves that cross the Pacific and Western Hemisphere over the next week or two before re-emerging over the Indian Ocean and helping to generate a new MJO-type event in early September, while enhanced convection either persists or evolves much more slowly across the Maritime Continent. Based on these outlooks, the MJO's contribution to the global tropical convective field will become increasingly uncertain during the outlook period, though anomalies consistent with Indian Ocean or Maritime Continent MJO activity look possible in early September.
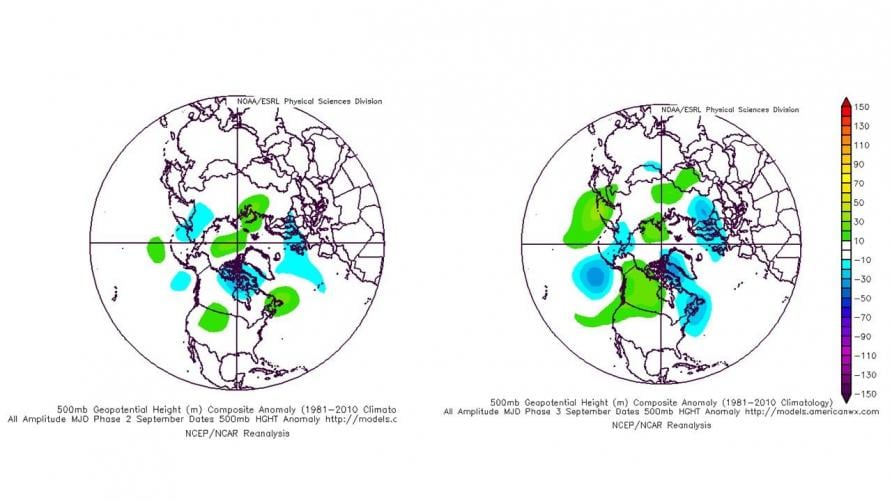
The MJO has been quite active in phase 3 (eastern Indian Ocean) but it now weakening, but with signs that the MJO may regenerate over the Indian Ocean (phases 2 and 3) in early September. These phases over the Indian Ocean tend to promote low pressure over northern Europe in September, so this backs up the EC sub-seasonal idea of unsettled first half of September at least, but perhaps continuing well into the second half too.
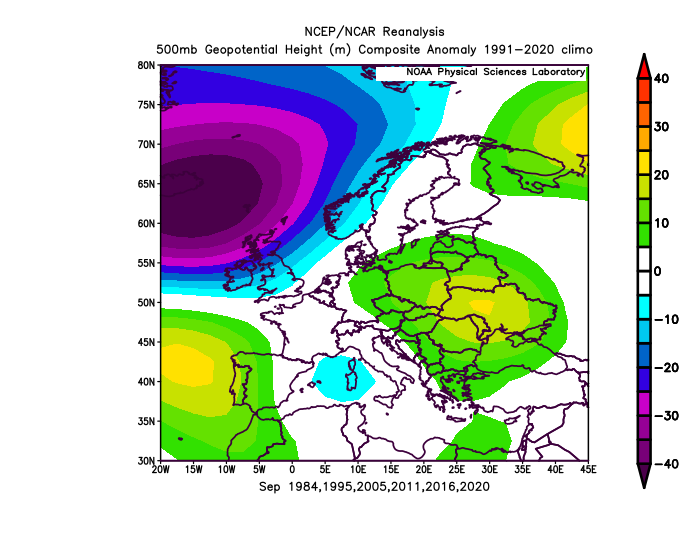
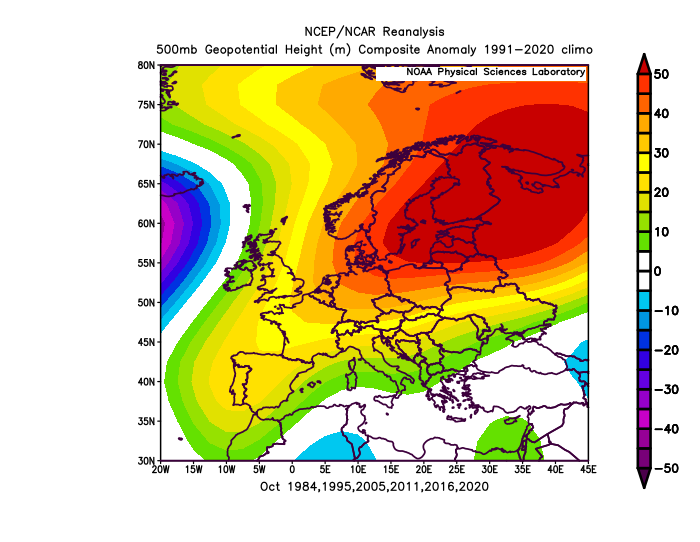
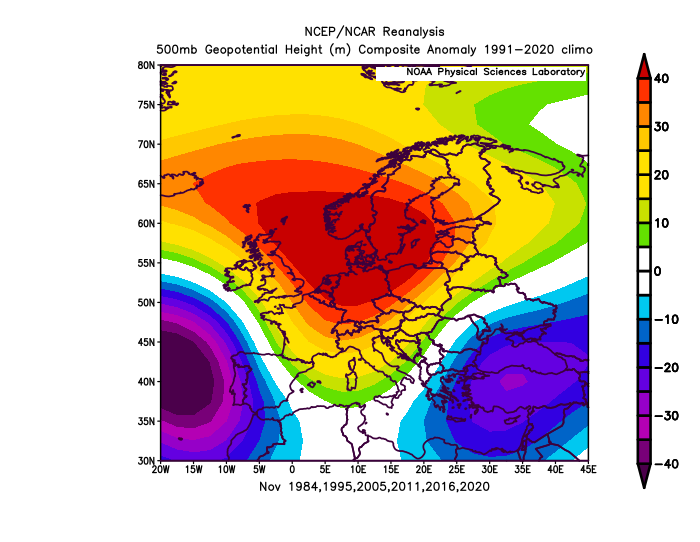
Looking through ENSO ONI (Oceanic Nino Index) records, there are 6 years since the start of the 1980s (bearing in mind the global climate has changed rapidly since then) that had a transition into a weak La Nina by and during the autumn. These were 1984, 1995, 2005, 2011, 2016 and 2020.
September analog - strong low heights anomaly close to the northwest with higher heights to the southwest and over Eastern Europe.
October analog - anomalously above average heights over NE Europe, lower heights west of UK.
November analog - strong heights anomaly east of UK. Average temperatures. Significant cold anomaly over SE Europe.
A look at the analog composites suggest troughing dominating over NW Europe than ridging in September - which is plausible - given most recent ECMWF weeklies outlook through to early October. This would infer temperatures around average for the month.
For October, analog composite shows high heights east of the UK as a whole for the month and low pressure to the west. This pattern would infer temperatures would be above average as a whole, with winds often from warmer south or southwest direction. The EC and NCEP suggest more of a high pressure anomaly for the month, while Met Office has low pressure / heights to the north and high pressure / heights to the south.
For November: analog shows troughing to the southwest and higher pressure close to the east This would suggest winds from the continent at times. However, the seasonal models show lower pressure / heights to the north or northeast, high pressure / heights to the south or west.
Looking at the all the composites for the autumns months for a developing weak La Nina, a negative IOD, alongside the sub-seasonal and seasonal model output - it seems confidence is fairly reasonable that September will be more unsettled for all parts that recent months in what has been a very dry and more often than not spring and summer on the whole. How long unsettled conditions that start the month is not certain, most unsettled in the first half, with ex tropical cyclones in the mix. But unsettled conditions may continue into the second half. October there is a signal for high pressure to dominate a times - especially towards the east, but with the flow from a southerly or easterly quadrants keeping temperatures generally above average, rainfall could be greatest towards the south and west. November the signals are more mixed, but favour a more unsettled month, with average rainfall and above average temperatures on the whole, but with high pressure never too far away to bring some drier and chilly weather later in the month. With anomalously warm sea surface temperatures around the UK, it is unlikely that temperatures will have much chance to be below normal.
Stay upto date with the long range forecast throughout the year with the Month Ahead Forecast - Updated Every Monday.