


Sea ice extent (the area of sea covered by at least 15% ice) is the most commonly used metric for tracking both multidecadal trends and day to day sea ice variability. In the Arctic, extent typically reaches an annual maximum in March, when it extends as far as 50N near regions such as Newfoundland, or off the coast of eastern Siberia. Over the northern hemisphere summer the ice melts, retreating northward until it’s contained almost entirely within the Arctic Ocean. The minimum extent invariably occurring during September. The ice cover then rapidly expands southward during the following winter, completing the annual cycle.
Annual Sea Ice Cycle Animation:
As is often highlighted in the media, the sea ice minimum extent has seen a rather steep downward trend since regular satellite observations began in the late 1970s. Since then, the average minimum extent has been reduced by about 40%. Rapid warming in the Arctic, referred to as Arctic Amplification, has largely been to blame. The September minimum extent doesn’t show a consistent reduction in each year, but rather shows huge amounts of interannual variability superimposed on a long-term downward trend.
Sea ice minimum trends:
So, what are the factors that determine how much ice will be remaining at the end the summer melt season? It is all related to the state of the ice? Is it the weather? Can we make any predictions?
We’ll explore these questions and more in the rest of this article!
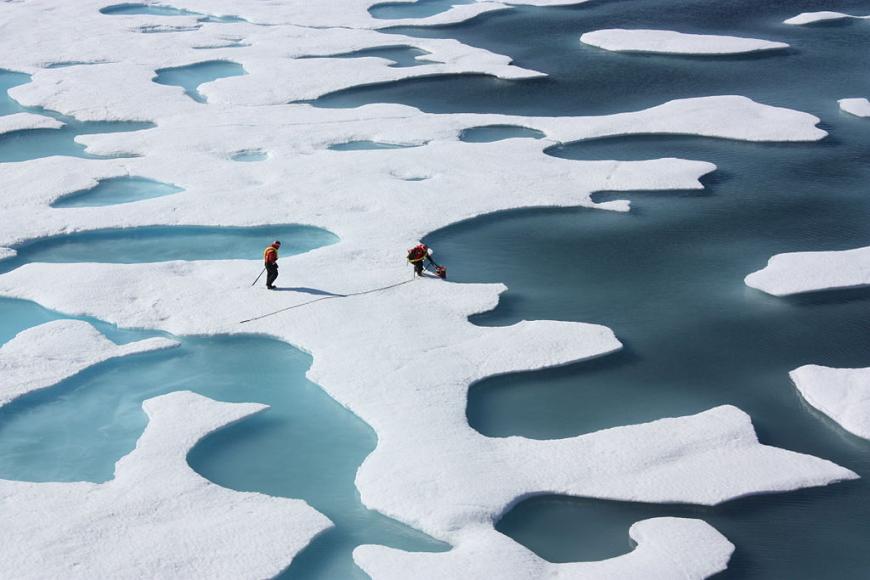 (Melt Ponds on the surface of Arctic Sea Ice, July 2011: Source: Wikimedia)
There are several processes and occurrences that are difficult to predict but can have a profound influence over the rate of ice loss during the melt season. One of the most important of these is the formation of melt ponds on the surface of the sea ice in May and June. Melt ponds form as thawing of the snow and ice causes melt water to accumulate on the sea ice surface. These ponds have numerous important effects, but a critical one is to lower the reflectivity of the ice, which encourages additional melting. Widespread early melt pond formation is strongly associated with smaller minimum sea ice extents in September, and is thus a very useful tool for narrowing down predictions of melt rates during the summer (Schröder et al., 2014). The story just doesn’t end there. Older sea ice tends to have more variability in its surface elevation and thickness, whereas younger ice that now dominates the Arctic tends to be flatter. The flatter profiles allow for much larger melt ponds to form, acting as a positive feedback mechanism. Greater melt ponds area = more ice melt = younger, flatter new ice = greater melt pond area.
This is one of the many feedback loops causing the rapid loss of sea ice in recent decades. Early melt ponds tend to form when warm high pressure becomes established across the Arctic, and was a key feature of both the 2012 (lowest September minimum on record) and 2020 (2nd lowest minimum) melt seasons.
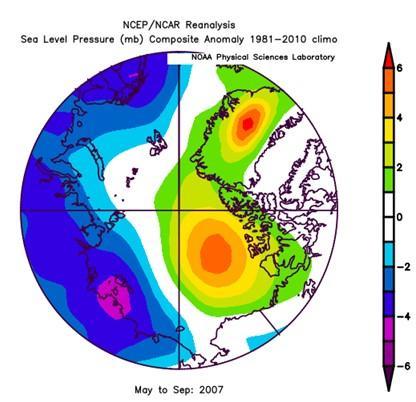 (Arctic dipole anomaly shown through the 2007 sea level pressure anomaly. Data from the NCEP reanalysis)
The Arctic Dipole Anomaly, in its positive phase, is an atmospheric pressure set up characterised by high pressure over the N. American side of the Arctic, with an opposing low pressure along the Eurasian side. This air pressure pattern tends to produce several important effects on the sea ice:
Many of the lowest sea ice years on record have been associated with positive phases of the dipole anomaly during summer, with 2007 being the strongest example.
This dipole pattern has a tendency to become stuck and persistent, so keep an eye out for it in the pressure maps across the Arctic. If it starts appearing a lot, it might hint at a fast rate of summer melt.
In recent decades, the Arctic has been warming at 3 or 4 times the rate of the rest of the planet. In fact, the last two melt seasons have been the warmest on record. Melt season temperatures now regularly average above freezing too and have a strong association with the minimum sea ice extent in September. There appear few reasons to believe that this year will buck the trend, so the strong and continued warming of the Arctic is an important consideration.
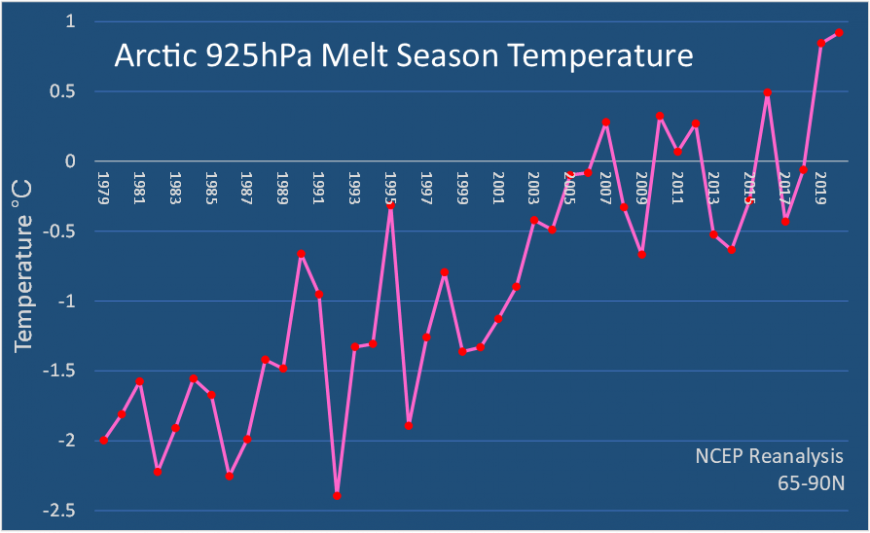 (Arctic temperature trends for the melt season (Apr-Sep) from NCEP reanalysis)
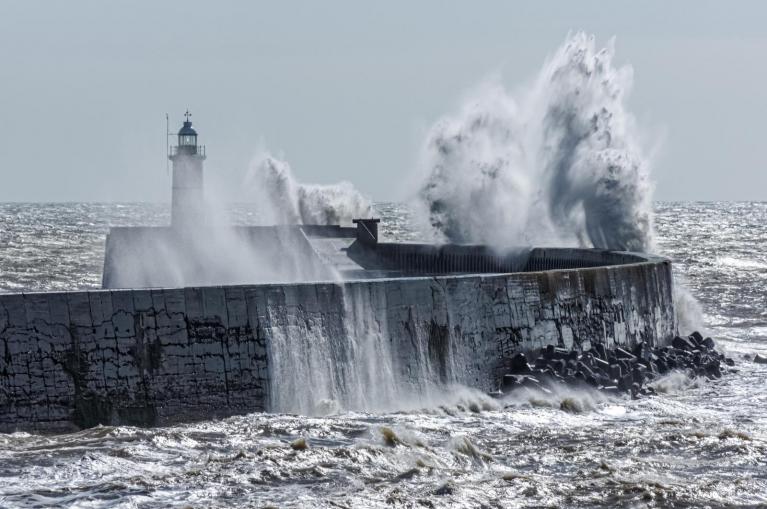
Of course, one-off occurrences of extreme weather can also play an important role. Two prominent examples come to mind, namely the Great Arctic Cyclone of 2012 (GAC2012) and the Siberian heatwave of 2020.
In early August of 2012, when Arctic sea ice extent was already lowest on record at the time, a powerful storm developed over the Pacific side of the Arctic. The storm hit a central pressure of 962 hPa as it moved over a region of low sea ice concentration. The resulting mechanical damage from the waves and upwelling of warmer waters instigated a sudden acceleration in ice loss, causing sea ice coverage to plunge to unprecedented new lows. These storms have the greatest potential to induce melt late in the melt season, especially if the ice is already in a fragile and dispersed state. Similar storms early in the melt season or during winter don’t produce the same immediate impacts.
 (Animation depicting the effect of the GAC 2012 on sea ice concentration in early August)
A heatwave in Siberia that began in spring of 2020 intensified during the summer with peak temperatures well above 30°C along parts of the Siberian coastline. This promoted rapid melt of the coastal sea ice, particularly around the Laptev and East Siberian Sea. The early opening of these waters to the 24-hour summer sunlight and heatwave air meant they could warm up rapidly and further contribute to sea ice melt later in the season. This likely allowed the 2020 extent to achieve the 2nd smallest September minimum on record, and the extraordinarily warm sea surface slowed the refreeze process in October, causing October 2020 to have the greatest negative ice cover anomaly on record.
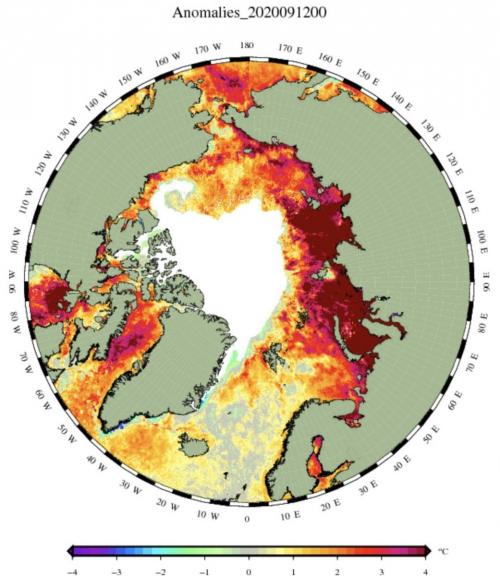 (Extreme Sea Surface Temperatures along the Siberian coast by the end of summer 2020. Source: DMI)
As well as the outside influence of weather events and persistent air pressure patterns, an important consideration in how the melt season will go depends on the current state of the ice itself. How old is the ice, how thick is it, how much ice coverage existed at the start of the melt season and what are the long term trends and variability like? These are features that we can know in advance and can provide a basis from which we can begin to estimate how the melt season may progress.
One of the most simplistic ways we can estimate how this melt season may end up is to examine what the long term trend in the September ice cover tells us, and what kind of value we get if we extent that trend towards the 2021 minimum. The image below does exactly that!
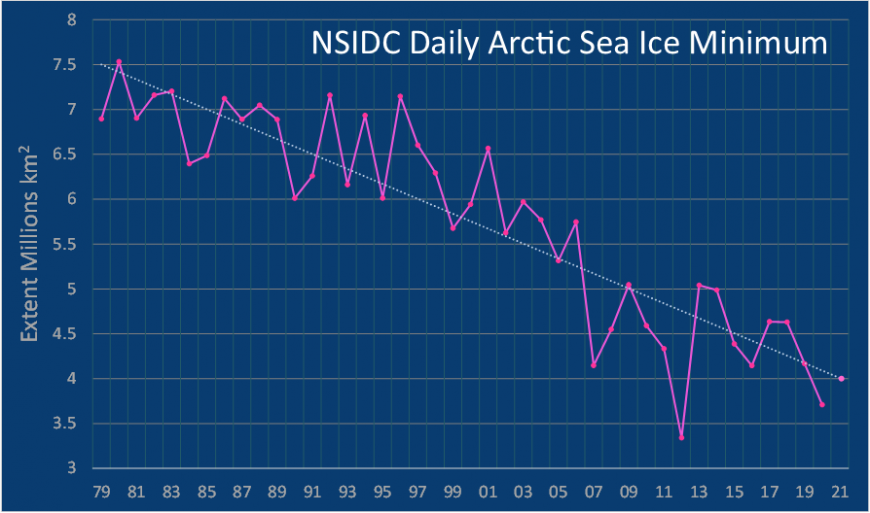 (Daily sea ice extent minima from 1979 to 2020, with a linear trend extending to 2021)
Extrapolating the linear trend gives us a minimum for 2021 of about 4 million km2, or the 3rd lowest minimum on record. There is a lot of variability about this linear trend, from almost 1 million km2 higher in 1996, to about 1.4 million km2 lower in 2012. A simplistic prediction from this would be 4 million km2, with an upper limit of 5 million km2 (8th lowest) and a lower limit of 3 million km2 (a new record low). But let’s try to add some more data and see if we can narrow that prediction down a little.
To begin with, we can look at how much ice cover we are starting the melt season with, or how great the March maximum was in comparison to other years.
 (Animation of the daily sea ice extent maxima since 1979 on the left, with the spatial distribution of ice extent and date of each maxima on the right. Data from the NSIDC)
The daily extent maximum this year was the 8th smallest on record (joint 7th smallest for the official 5 day average), which means there is 1.25 million km2 less ice cover to melt compared to the average of the 1980s. Of course, much of this ice is present in the peripheral seas outside of the Arctic Ocean and is seasonal in nature (it completely melts away every year) so it doesn’t really matter for the regions that retain much of their ice through the summer. As such, when you remove the long-term trend from consideration, the maximum in one year is rarely a good predictor of the minimum. But in some regions, such as around Svalbard or near the Bering strait, this a lack of ice cover can allow warmer water from both the Atlantic and Pacific Oceans to influence sea ice thickness and cover in areas that might matter near the end of the melt season. This takes us to the next important factor, the overall volume of sea ice (thickness plus spatial extent).
 (Arctic sea ice thickness derived from PIOMAS data as of mid-March 2021. PIOMAS website)
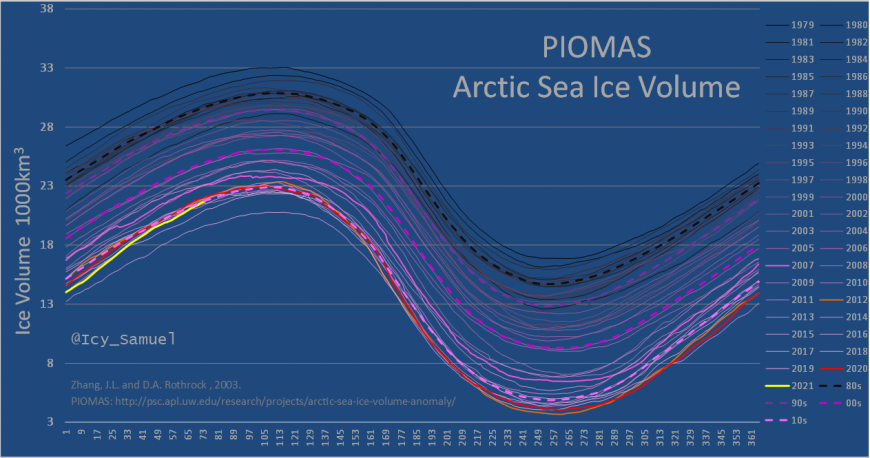
The overall Arctic sea ice volume, as of mid-March, was the 5th lowest on record and about a quarter less than the average volume in the 1980s. This, once more, includes areas outside of the Arctic ocean that melt every year anyway. However, if we examine just the volume of the central Arctic basin (Arctic Ocean minus the seas near Alaska, Russia and north of Scandinavia) the volume is the 3rd lowest on record, marginally above the two lowest years, 2017 and 2018.
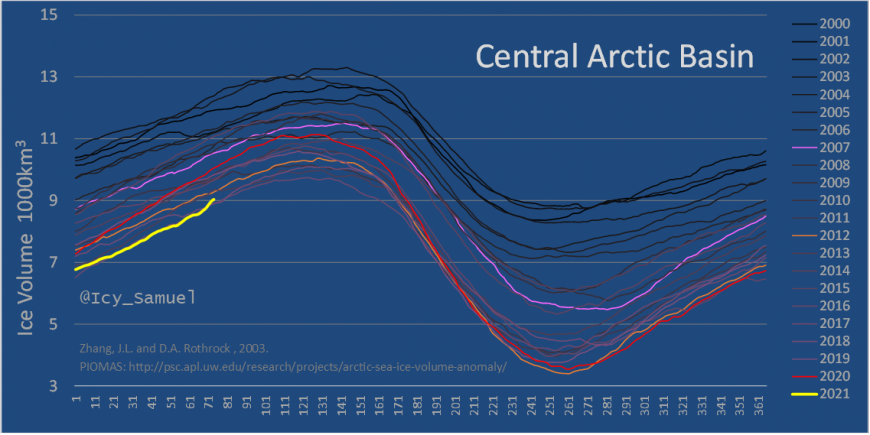 (Sea ice volume in the CAB from PIOMAS data, processed by Wipneus on the ASIF, as of mid-March 2021. PIOMAS website: http://psc.apl.uw.edu/research/projects/arctic-sea-ice-volume-anomaly/)
This suggests that the overall volume, and the volume at the core of the Arctic, is much less than normal. But, it’s not all bad news. Favourable winter weather has allowed the ice volume along the Russian Arctic coastline to grow a surprising amount, reaching the 4th highest since the year 2000 for the combined Kara, Laptev and East Siberian Seas. Despite being first year ice that’s a little weaker compared to ice of similar thickness that lasted many years, this region of surprisingly thick ice may offer some resistance to melt, especially if we experience a repeat of the 2020 heatwave conditions.
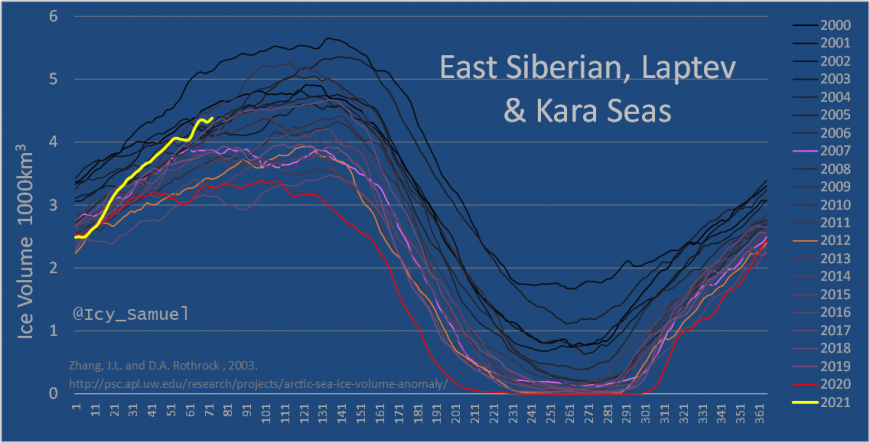 (Sea ice volume along the Russian Seas from PIOMAS data, processed by Wipneus on the ASIF, as of mid-March 2021. PIOMAS website: http://psc.apl.uw.edu/research/projects/arctic-sea-ice-volume-anomaly/)
So, it appears we have several things to consider. First, the negatives:
And the positives:
Volume along the Russian coastline is doing surprisingly well, especially considering the delayed refreeze last year. This may slow the loss of sea ice extent, especially early in the melt season.
The surprisingly large volume along the Russian coastline could be crucial in preventing another record minimum from occurring this year and is very likely to prevent the early opening of these seas as occurred last summer. This may also protect what looks like some very thin and weak ice in the central Arctic. However, the long-term trends still look bad and the volume overall is quite low. We also have the many unknowns that could cause a September sea ice minimum outside of expectations, such as early melt pond formation, the Arctic dipole anomaly and the other weather patterns and extreme events.
All things considered, my estimate for this melt season is 4.0 million km2 (with a range from 3.4 to 4.6 million km2), the 3rd lowest minimum on record and in line with the long-term trend.
Now, lets wait and see how mother nature makes a fool of me!
Paper discussing how early melt season pond formation is useful in predicting the subsequent sea ice minimum
Schröder, D., Feltham, D., Flocco, D. et al. September Arctic sea-ice minimum predicted by spring melt-pond fraction. Nature Clim Change 4, 353–357 (2014).
Paper discussing the role of the Arctic Dipole Anomaly on summer sea ice
Wang, Jia, Jinlun Zhang, Eiji Watanabe, Moto Ikeda, Kohei Mizobata, John E. Walsh, Xuezhi Bai, and Bingyi Wu. "Is the Dipole Anomaly a major driver to record lows in Arctic summer sea ice extent?." Geophysical Research Letters 36, no. 5 (2009).
Loading recent activity...


