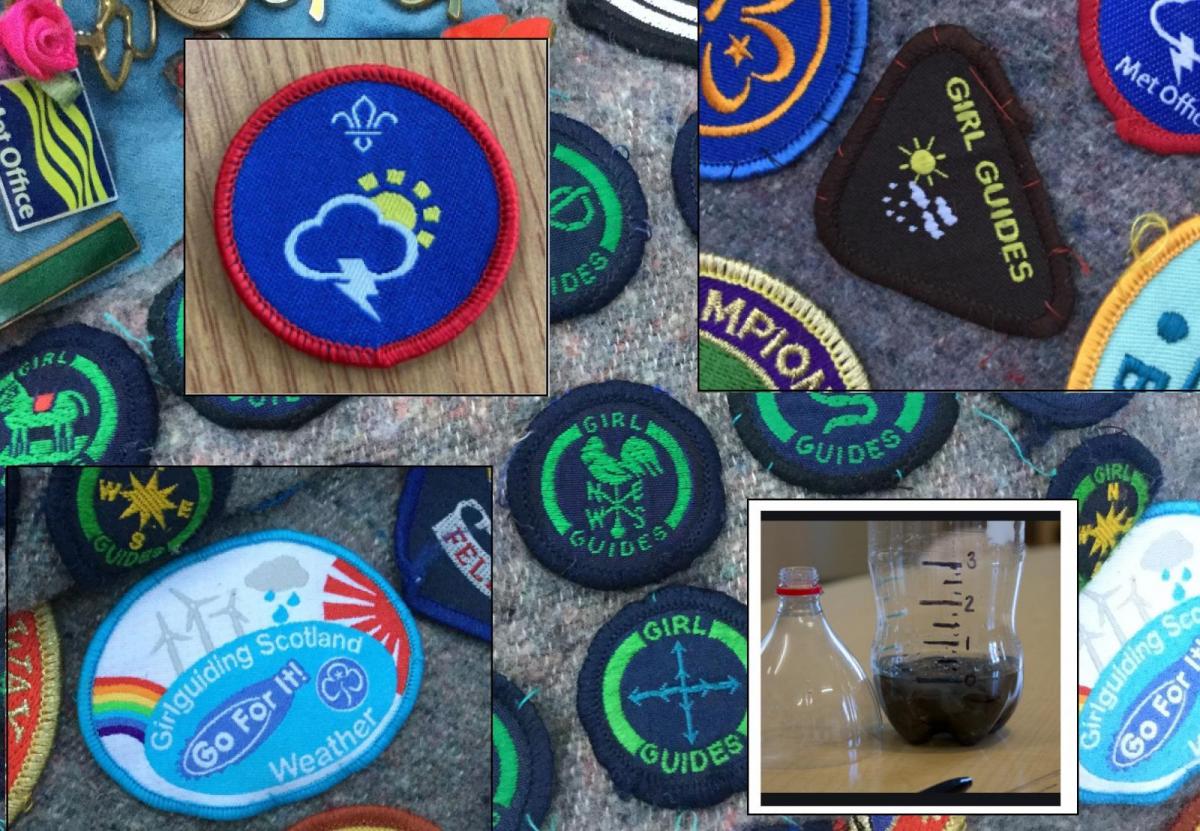
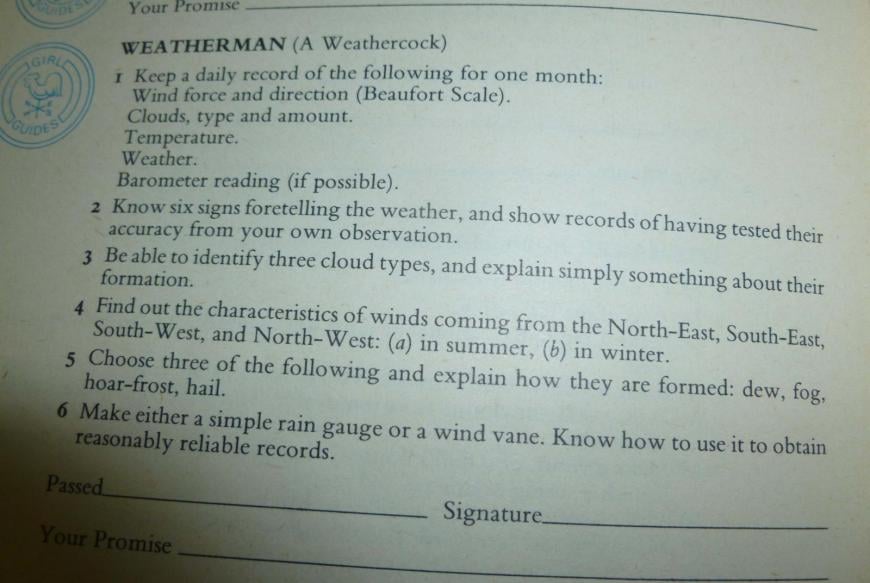
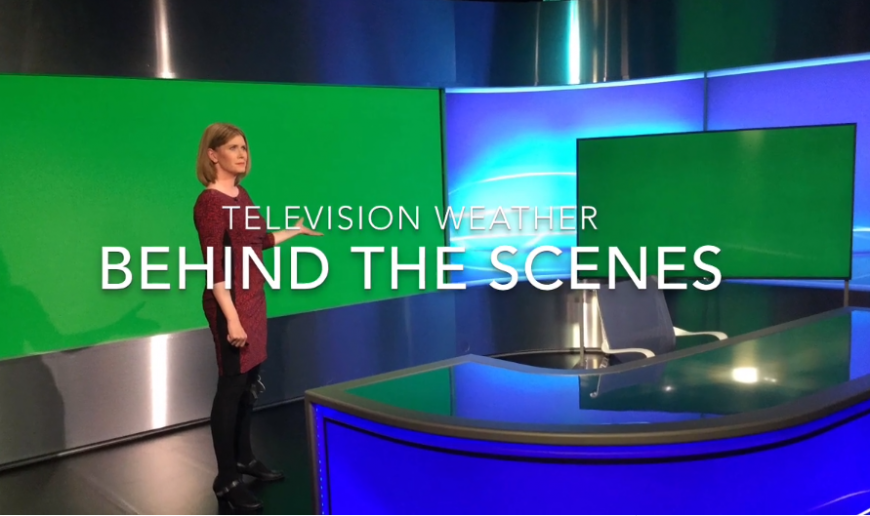
Over the decades, Scouts and Guides have had various interest badges including ones about the weather. My own interest was sparked by working for my Girlguiding Weather badge and led to me training to be a weather forecaster with the UK Met Office. You might be a Scout researching your Meteorologist activity badge or just someone interested in learning about weather and wanting to look at the basics. Here's a step by step guide to accompany your two-week observations of the weather where you are.
There are two parts to the badge.
A. Preparations to start your two week daily observations.
B. More meteorology to enable you to forecast the weather.
This guide will look at how weather data is measured, how you can record it yourself. Get to grips with clouds and air masses. Begin to understand the forecast process and weather charts.
1. Weather Observations – date and time
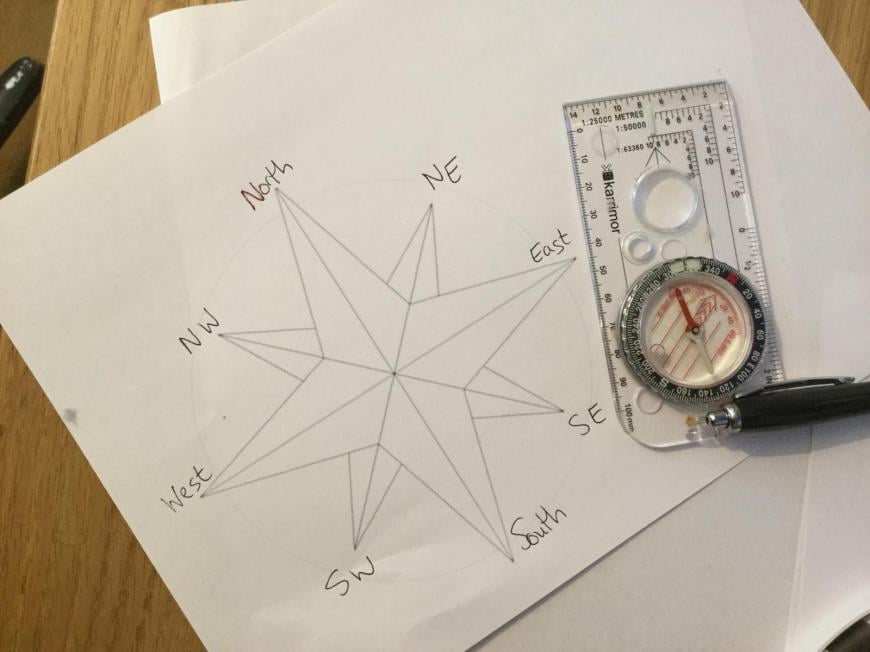
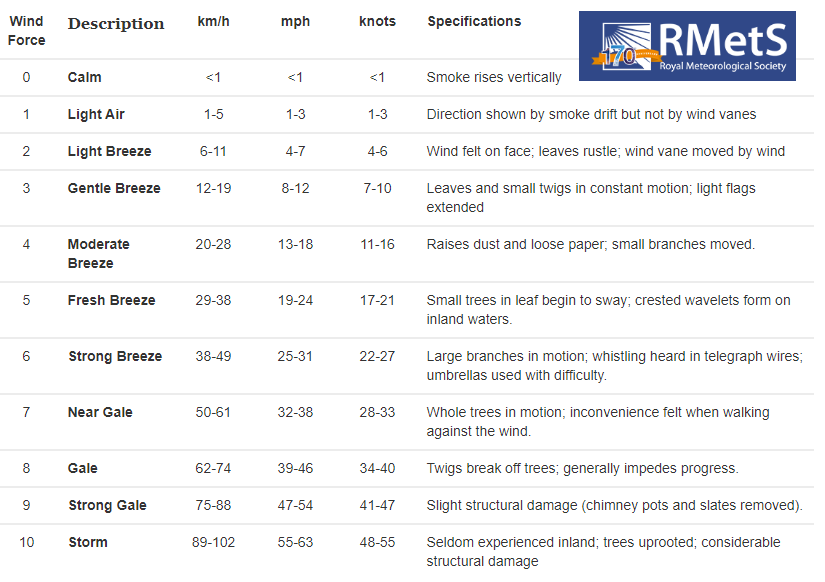
Wind - find out where north is. Create a paper eight-point compass. Find out about the Beaufort scale
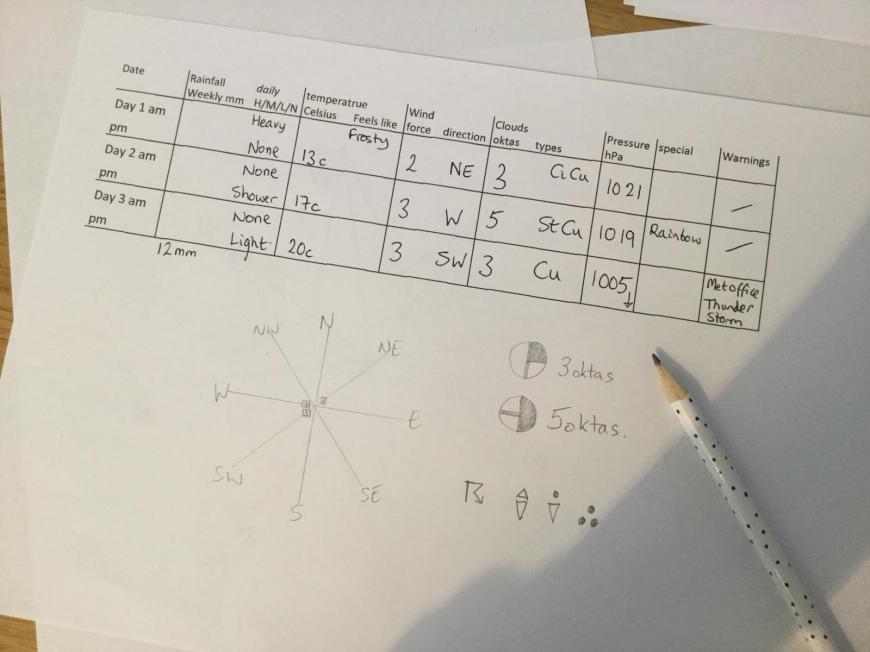
Rainfall - Make a rain gauge. Rainfall can be recorded weekly. If you can’t record the rainfall outside just record Heavy/Moderate/Light/None each day
Clouds – find out about Octas. Also Cumulus clouds, Stratus and Cirro, Alto, Nimbus.
Temperature – if you have a thermometer, great. If not, create your own scale of how it feels Hot, cold, warm, cool. If you have a max/min thermometer jot down both values.
Pressure - if you have a wall barometer take readings in hPa, same as milliBars. If not, you can look on a weather app or guess from surface pressure charts. (see section 6)
Make a chart to fill in with some of these values, you don’t have to do all of them but try to do at least one full observation each day for the two weeks. You can also set up an outdoor thermometer, or a wind vane.
How to measure 1.a WIND
Wind Speed is measured in miles per hour. Wind Force is a scale developed by Beaufort, using how physical things look and behave on land or at sea. You don’t need a measuring device, just have a look and fit the characteristic to the scale.
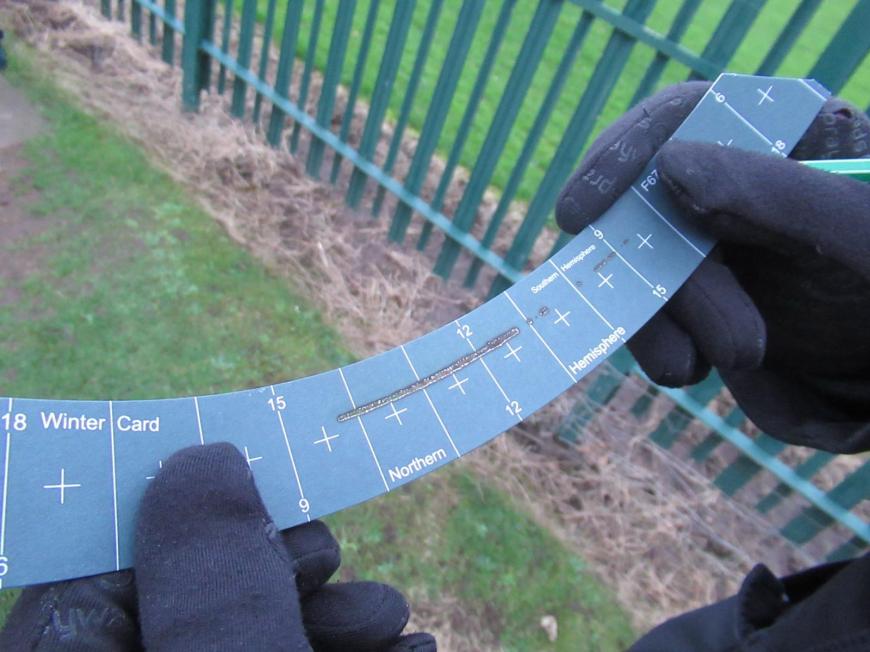
Thinking about your own home, work out which way is north. Use a compass if you have one or think about where the sun rises (east) and sets (west). Secure your paper compass to use each day.
Wind direction is where the wind is FROM. So if you were looking southwards, and the wind was in your face, it is a southerly wind. If the wind was coming from behind you, blowing your hair forwards then it would be a northerly wind. Usually, we use an 8 point compass, North South East and West with NW NE SW SE.
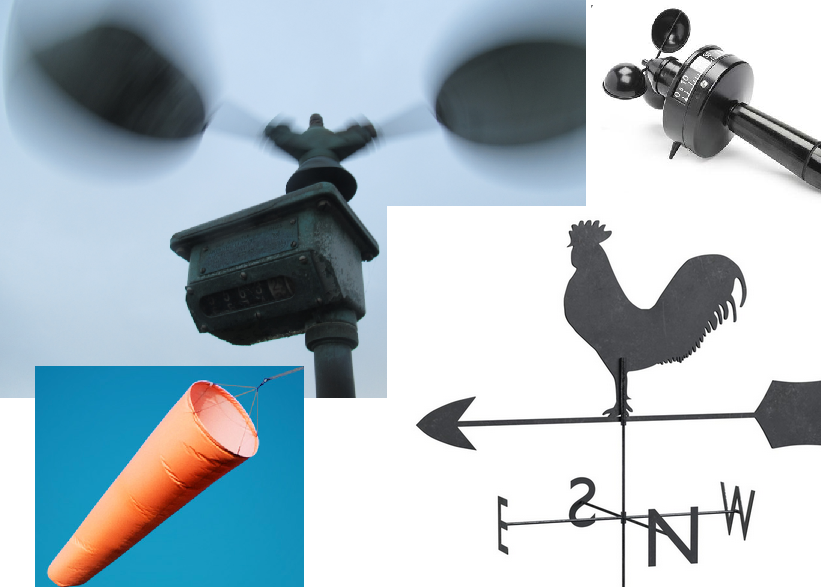
To measure wind, we use an anemometer and a wind vane or windsock. The UK Met Office used to have a cockerel weather vane as their logo for many decades.
If the winds are very light it can be hard to tell the direction, you can throw dry grass or leaves up in the air to help. Or mark down as VAR for Variable wind direction if really light.
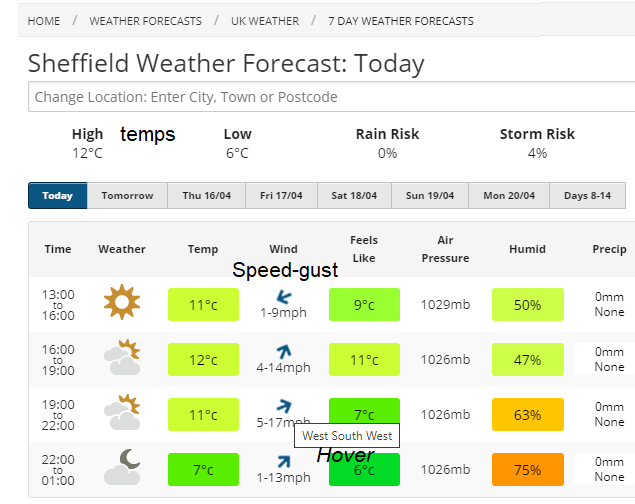
When you have done your first wind observation have a look at the 7-day forecast, put in your nearest town or postcode. If you hover above a wind forecast it will tell you the direction. Just to check you are writing it the correct way round. It also gives you pressure and temperature here as a guide if you don’t have a thermometer or barometer.
- "WIND West or southwest, veering northwest later, 5 to 7, perhaps gale 8 later. "
Have a look at the Inshore Waters forecast and the Shipping Forecast from the Met Office. Both of these use the Beaufort scale.
There are other wind scales for hurricanes, typhoons and tornadoes. We sometimes get ex-hurricanes here in the UK, the leftovers of tropical systems which can still bring stormy conditions. We do get tornadoes occasionally which causes intense short-lived damage but nothing like the devastation seen in the United States.
Optional -You can also create a simple wind rose to display your wind direction data (some show force as well). What is the prevailing wind for your location after two weeks? (the most usual)
In the UK the prevailing (most common) winds are from the SW. Winds do change with height, we are interested in the winds at the surface . (Meteorologically it would be 10 metres above the ground to stop friction effects). Don’t worry too much, just try to observe where the wind is coming from.
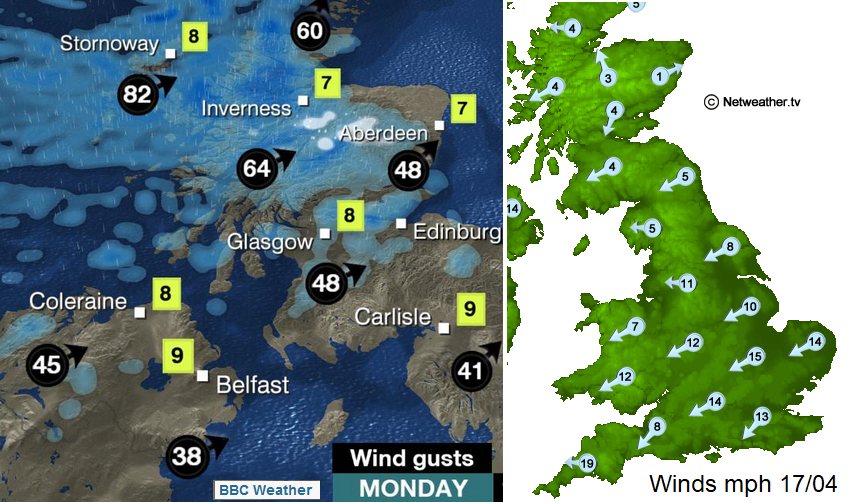
If you are watching a television weather forecast, say after the news or in BBC Countryfile on Sunday, you will see the wind arrows with a direction arrow and figure, this shows strength in miles per hour. Sometimes they mention gusts which are shown on black arrows. These are sudden, temporary stronger winds and these gusts can reach hurricane force. We do not get actual hurricanes, the waters around the UK are too cold
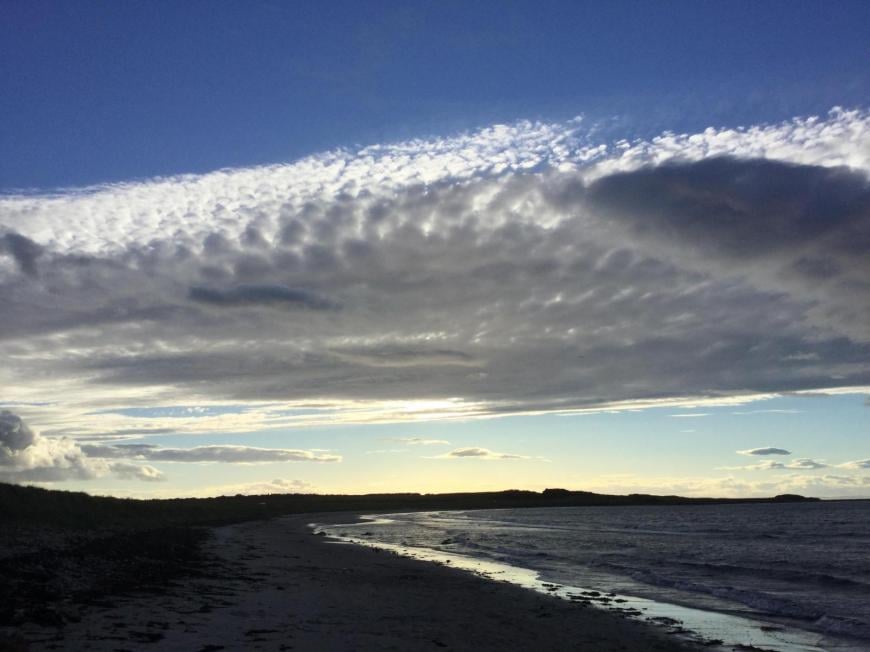
1.b Cloud Type and Extent
You can include the colour, level (low medium high), overall amounts (lots, little, none) and shape; fluffy, layer, wispy. Observing clouds takes practice. They are split into three levels, low, medium – alto and high – cirro.
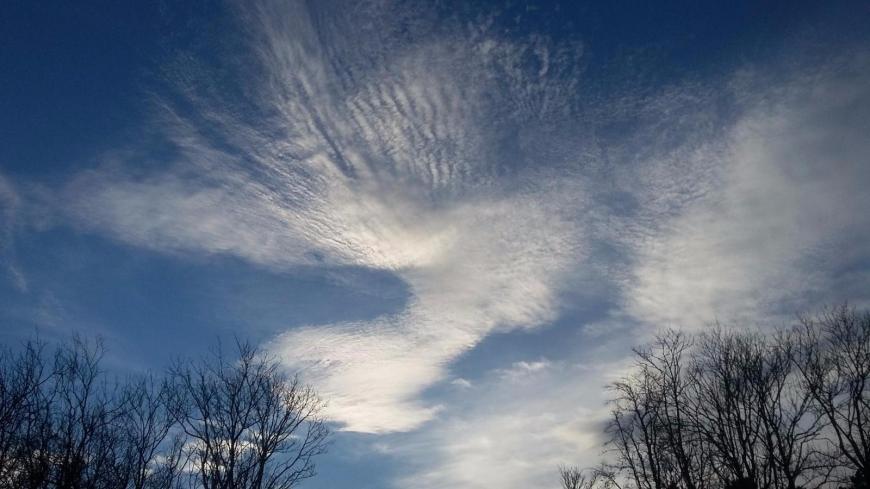
There are different types, Cumulus the fluffy, lumpy, cotton wool-like ones. Stratus which is a layer, like a blanket and wispy tufts Cirrus. Also, Nimbus for rain-bearing. Combining these names you get most of the clouds. Altostratus, Cirrocumulus, Nimbostratus
The World Meteorological Organisation WMO has a Cloud Atlas which is helpful.
Cloud amounts are recorded in Octas (eighths of the sky at three levels). You have to imagine the sky is divided into eight pieces like a pie. If all the clouds were squashed up, how much of the sky would they fill? This is done at the three levels, low, medium and high. For example, 2 Cu 5 Ci, Two octas of Cumulus cloud and five octas of high Cirrus.
1c. Temperature
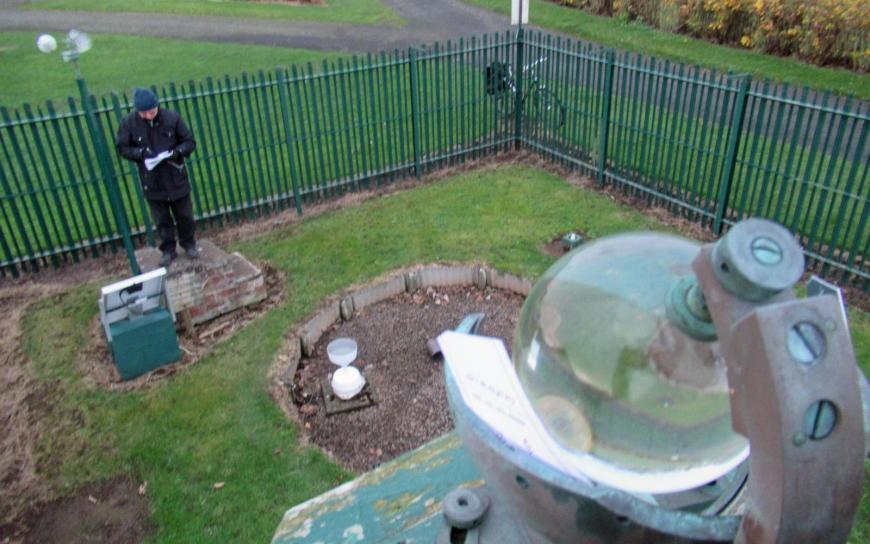
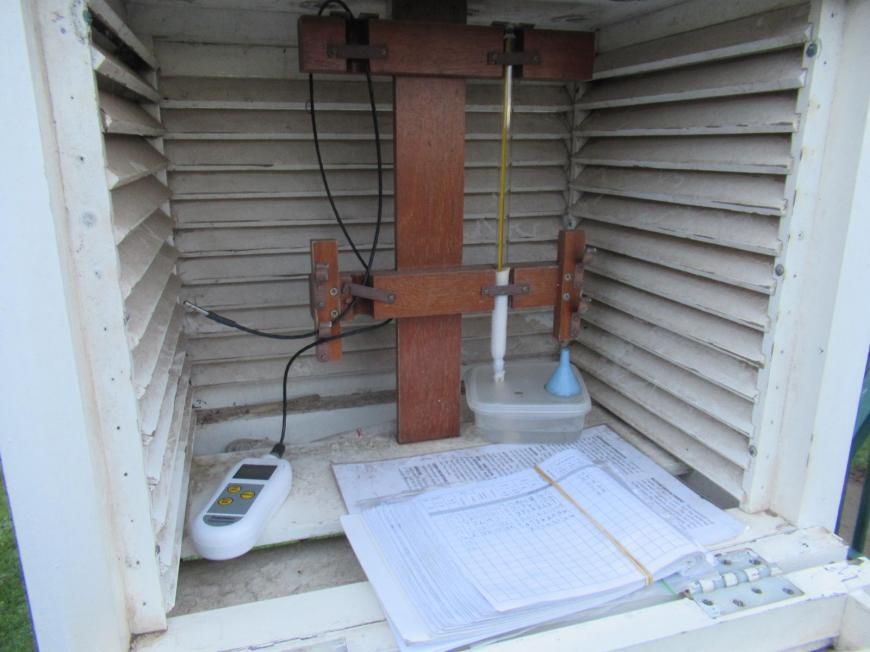
Meteorologists measure and compare air temperatures in the shade around the UK and the world. So not in a car, a greenhouse or in direct sunshine. A shady, airy spot for the thermometer is needed, up off the ground. We use Celsius, although a thermometer may also show Fahrenheit. Inside a Stevenson screen, it is shaded, airy with slats so that the air can flow over the thermometer. Official observers have to be quick reading it and the door always opens to the north, so that bright sunshine doesn’t change the observation.
The maximum temperature of the day usually occurs mid-afternoon. If you have a max/min thermometer it will record the highest and lowest for you , you just need to remember to reset it each day by pushing the button back in the middle.
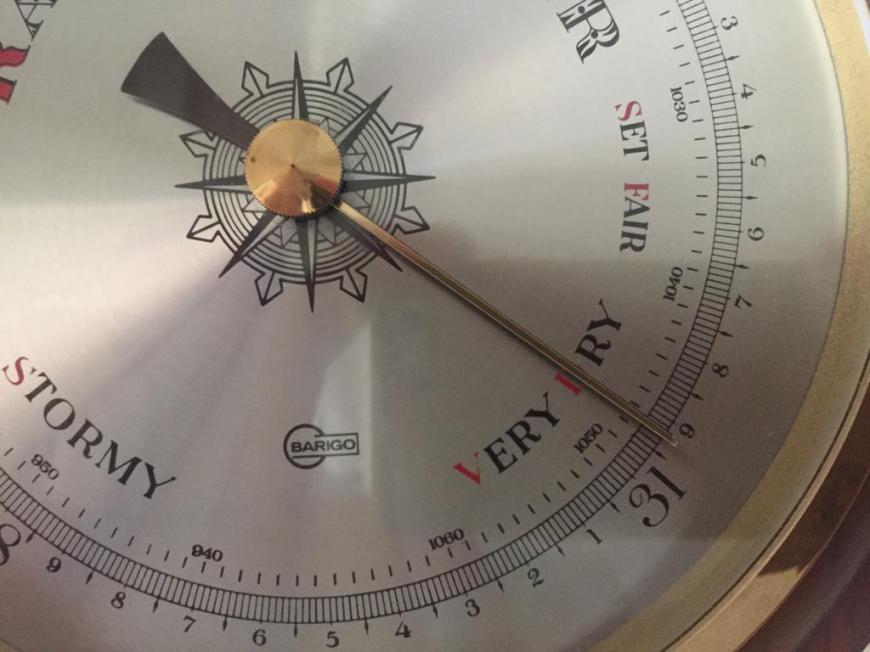
1d. Pressure
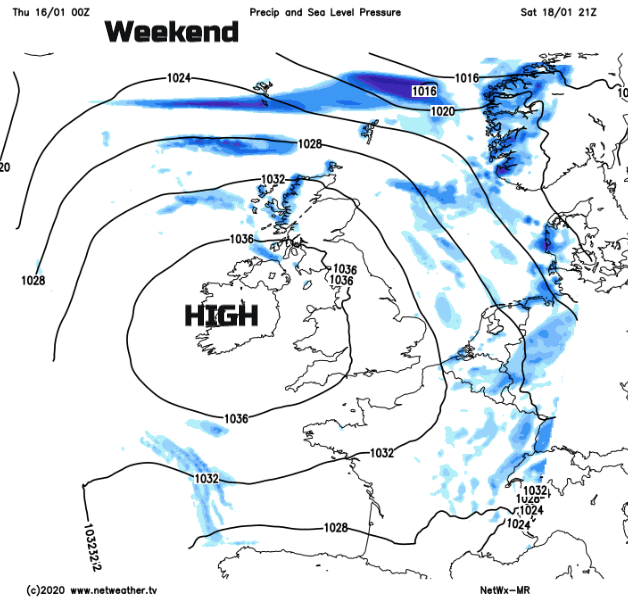
A barometer is used to read pressure, you may have seen one with Fair, Changeable, Rain, Storm written on it. A pressure reading on its own can be in milliBars or hPa (hectaPascals). A reading of 1020 to 1050 is high over the UK usually bringing settled, fair weather. It can be cloudy for days, or sunny for a week. Sometimes stubborn cloud is thick enough to bring rain. Winds at the centre of the high will be light, so fog forms by night where it is clear. The highest temperatures in summer rely on steady high pressure situations. In winter high pressure nearby can result in our coldest weather, especially when snow is lying.
The Girl Guides weatherman badge from 1970s
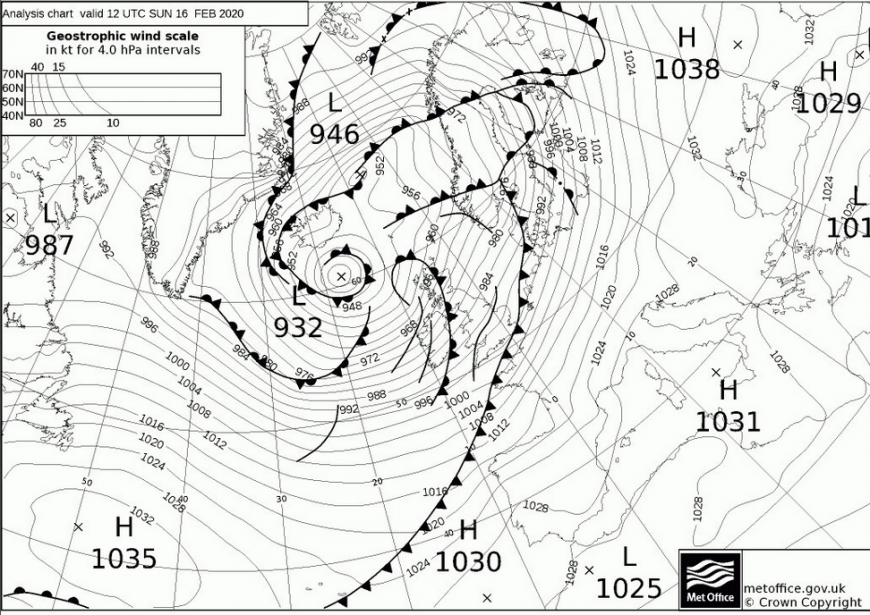
A pressure of 950-980hPa is low and often signals wet and windy weather. Deep low pressures arrive as Atlantic storms. Hurricanes and typhoons are low pressures. It is the change in pressure that is important. Is pressure rising, falling or steady? If you look at a pressure chart you can read along the lines of equal pressure (isobars) and find out what the air pressure will be near you. This chart shows Storm Dennis, the low to the NW of the UK near Iceland. Lots of isobars on the chart shows windy weather.
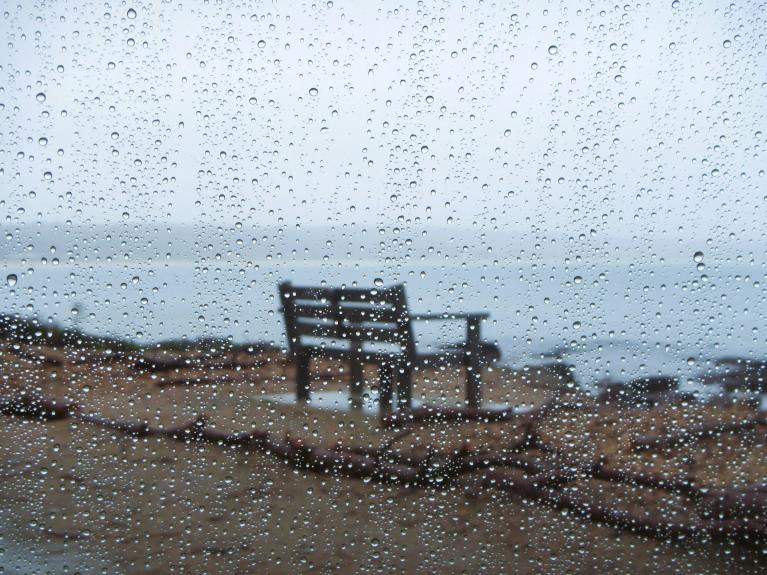
1.e Rainfall
Across the UK there are many rain gauges. These belong to the UK Met Office and the Environment Agencies who monitor the flooding. The data also helps with weather and flood warnings. Some need a person to do the reading and emptying, others are automatic. We use millimetres now (it used to be inches).
Make sure your rain gauge is secure and won’t fall over in the wind. That it is not too sheltered, say by an overhanging tree and fill it to a set point so that you are starting with a flat level and mark off a scale. You can empty it back to the zero level each week or just keep going as long as it won’t overflow. If you are making one out of an old plastic bottle putting the top part inverted, inside it stops the rain evaporating away in the sunshine.
1f -Humidity – A more tricky one. This needs a pair of thermometers, one a dry bulb and the other a wet bulb. The second has its end wrapped in a muslin fabric dipped in water, it needs to be kept moist. The difference between the two readings allows Relative Humidity to be calculated. If it is foggy, they will both read about the same, near 100% RH, if the air is dry, there will be a big difference and so lower RH. Humidity makes a big difference to how extreme temperatures feel. When London is hot and humid, it can make people feel terrible. Dry air can be devastating for wildfire situations. These pairs are used at the surface and found in the white Stevenson screens, but satellites can work out the humidity high up in our atmosphere.
You will be taking surface observations, across the world there are millions of observations being taken weekly, daily or each hour with many other observations being recorded from weather balloons going up in the atmosphere, from ships and aircraft and from space. This data is the start of the forecast.
Part 2
Start recording your weather. You can include as many columns as you like, depending on what equipment you have available. Have a go at the Wind force, direction and cloud types. Make sure to go outside if you can. A day can look gorgeous and sunny but in fact, be chilly and windy.
Weather observations are taken every hour around the world with some being done automatically by machines, others by a person. This might be a trained weather observer, someone at air traffic control centre or military airfield, people on ships out at sea or volunteers who are just interested in the weather. This clause allows you to see weather patterns at your location and become familiar with observing.
It is better to take the observation at the same time of day, but don’t worry if that doesn’t always happen. The people taking the official observations around the world undergo training and there are strict procedures for recording the official data.
Special - Hail, measure diameter, compare to coins for size or in photos. Note thunder or lightning, rainbows or fog.
My favourite bit of observation kit is a sunshine recorder. If you can visit a weather enclosure you may see one, up high, a glass sphere with a metal arm where special paper is placed each day and would scorch in the concentrated sunlight.
Part 3 Cloud types, find out about Cumulus and Stratus, describe how they are formed. Learn about two other special clouds.
e.g. Altocumulus Lenticularis (look like spaceships) and Altocumulus Floccus Virga (looks like jellyfish) are all good ones. Thunder clouds, the Cumulonimbus. There are many others.
Cumulus links to convection and warm air rising. Stratus is linked to fronts and the slower mass ascent of air.
When observing, try to get a good view of the sky. A cumulonimbus could be hiding behind your home. Don’t look at the sun. The sky in the morning could be very different to the midday or evening sky. Working out heights is tricky, unless you have a cloud height recorder machine (a high-powered laser bounces up to the cloud base and back, giving a reading). It can be difficult to decide if it is high altocumulus or cirrocumulus. Or between stratocumulus or low altocumulus. Don’t worry too much.
Cirrostratus can give a halo around the sun or the moon. Altostratus gives a milky appearance to the sky. The Royal Met. Society have a Cloud wheel download to help with identification
4. Find out about Air masses
The warm air masses are named Tropical for the UK, approaching from the SW, S or SE. The cold ones involve Polar or Arctic air. Their effects vary across the UK. For example, the Highlands of Scotland will have a cool showery flow in a Polar Maritime air mass, but London can be more sheltered, drier and brighter. In a Polar continental air mass, eastern Britain can get heavy snow showers, but western Wales is sheltered and dry. Try to work out if an air mass will bring rain or snow and where this might fall.
Met Office Video on Air masses
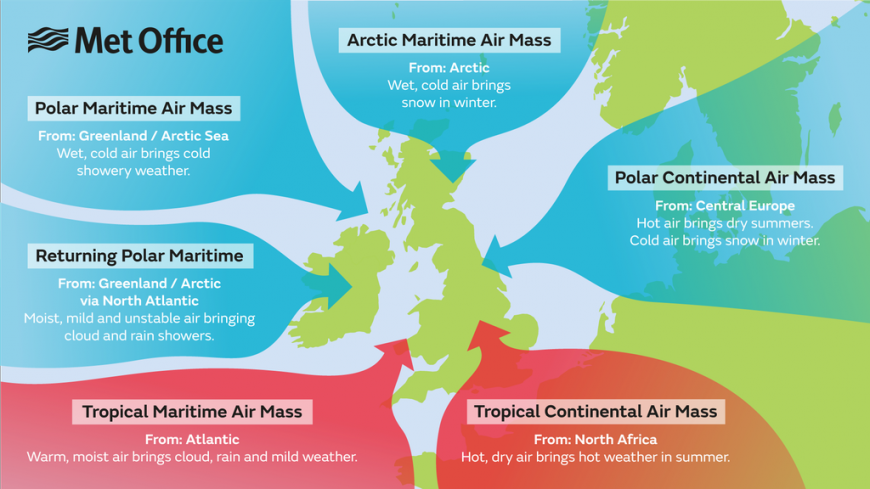
The polar continental air mass is more likely to bring heavy snow to eastern Britain in winter. The Arctic maritime can bring snow showers to Scotland (particularly the north) and down North Sea coasts, sometimes to Northern Ireland and north Wales. Other areas tend to stay fine but cold. The tropical maritime airmass can bring heavy thundery showers in summer, particularly to southern England. The tropical continental air results in high temperatures in summer.
5. How are weather forecasts created?
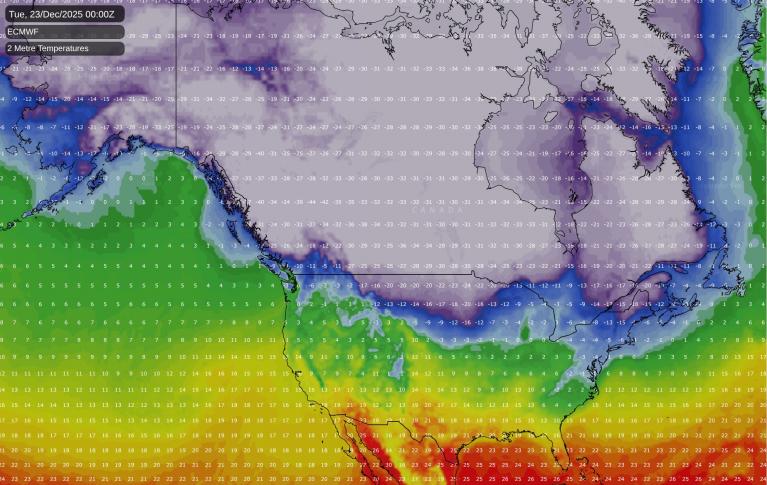
The weather forecast is an ongoing process using the last model run and new data from global observations, what is the weather like now. Huge mathematical calculations are done by supercomputers to generate the model output, the new forecast, which is run several times a day. Where will that low pressure go, how strong will be winds be, what is the Jetstream doing, what time will the rain arrive?
Then the computer output has to be refined, translated and interpreted. Each country’s model has its own personality, things it is strong at, other bits that it may struggle with. Video - How the forecast is made. Met Office
The output of a weather forecast can be seen on a phone app, website, television or heard on the radio. It might be a group of symbols and text or a short presented broadcast after the news. It has been shrunk!
Think of the weather forecast as an important message but you don’t have much time to share it. You have been given loads of information and you need to sort it all so that you have the key points for your broadcast.
Forecasters have to think about what day of the week it is, is the weather changing significantly? Is severe weather on the way, could people or property be seriously affected, are there any big events coming up or is it a busy time of year? Before Christmas, everyone wants to know about snow, before holidays will it be warm and sunny. Flood-hit areas don’t want any more rain, farmers might be desperate for rain in a drought-hit summer. You have to know your audience to give a good forecast.
If you are heading to camp you will want to know when it will rain, especially when pitching and striking camp, how cold it might be by night. If it’s going to be hot and sunny to keep an eye out for sunburn and to store your food correctly.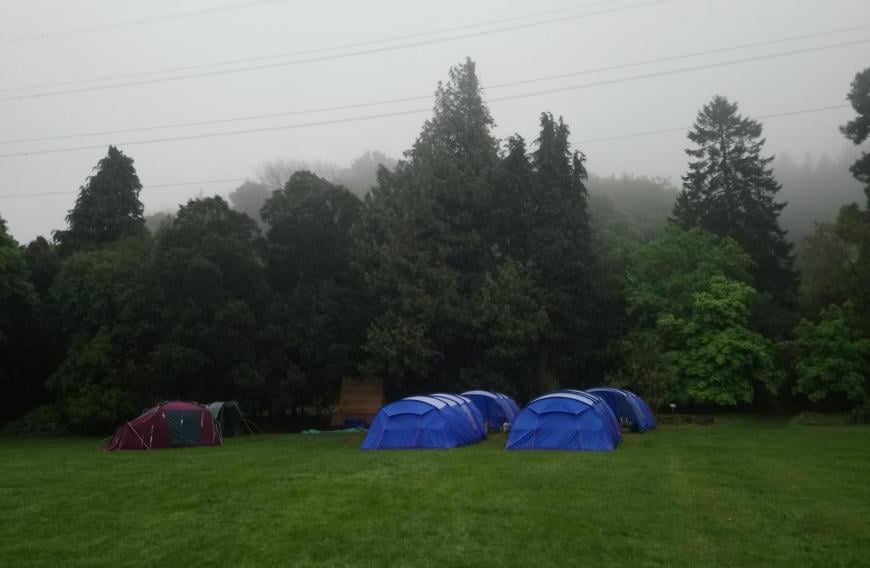
6. Understanding synoptic pressure charts
A synoptic weather map shows isobars, lines of equal pressure with highs and lows marked and weather fronts drawn in. Just like an ordnance survey map of hills and valleys, if you see closely packed isobars there is a steep change. On a pressure map, a tight gradient shows strong winds, quick movement of air from high to low pressure. Where there is lots of space in between the lines, there will be light winds.
In the northern hemisphere winds move anticlockwise around a low and clockwise around a high. They will be timestamped, usually 12 hours apart. First, an actual pressure chart, the starting point at time zero T+0. Next a forecast chart 12 hours on, T+12. The time is shown in UTC Co-ordinated Universal Time, which is GMT or sometimes called Z for Zulu 12Z
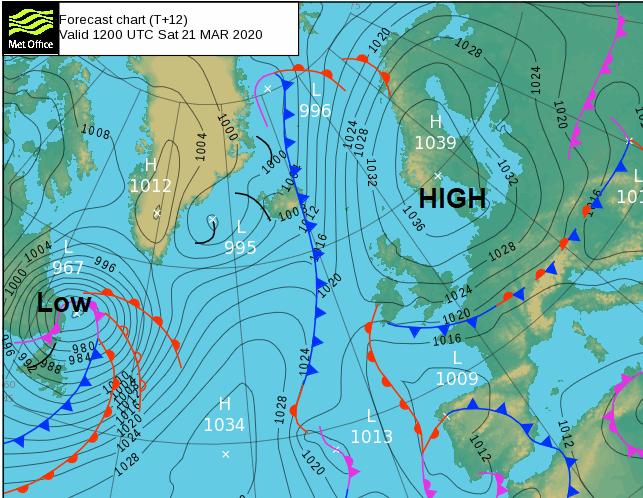
Weather fronts show the boundaries of air masses. Cold fronts are blue with little triangles and warm fronts are red with semi-circles. The air is moving with the semi circles or triangles out front. The purple ones are called occluded fronts and have a semi-circle by a triangle.
“The word occluded means 'hidden' and an occlusion occurs when the cold front 'catches up' with the warm front. “ MO
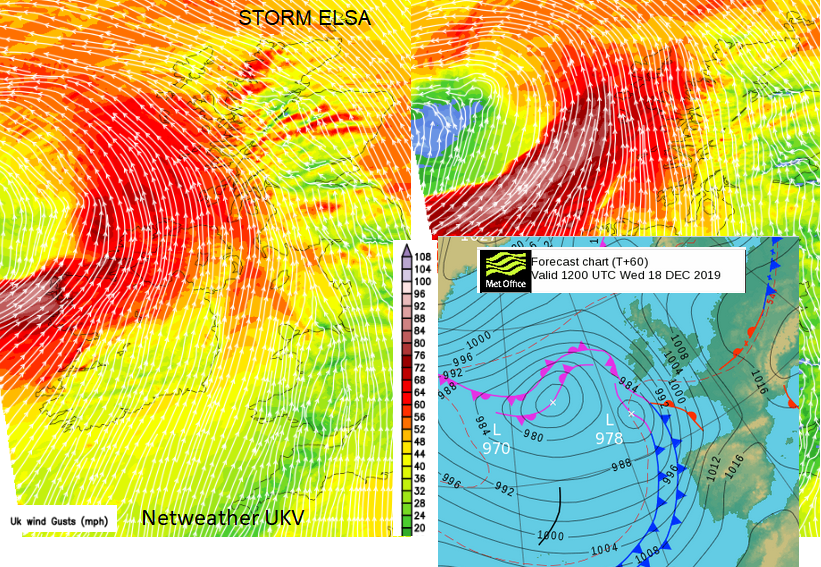
Along the fronts, you will find cloud and rain. Cold fronts are often more active and can bring heavy rain or sharp downpours. The plain black lines are called troughs and mark areas where clusters of showers are likely. Behind a warm front, there will be warmer air. If a cold front moves down from the north you would expect temperatures to fall. Below shows active cold front from Storm Elsa with damaging gusts and black line trough marked to show following sharp showers.
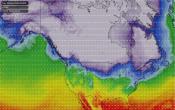
A good way to look at the current weather is by using weather radar. This is actual data, so observations at this time, and can show frontal rain, cloud, showers, snow, lightning and thunderstorms. Have a look at a synoptic chart and then compare to the actual weather on the radar or satellite picture. Have a think about where the air is flowing from, what air mass it might be.
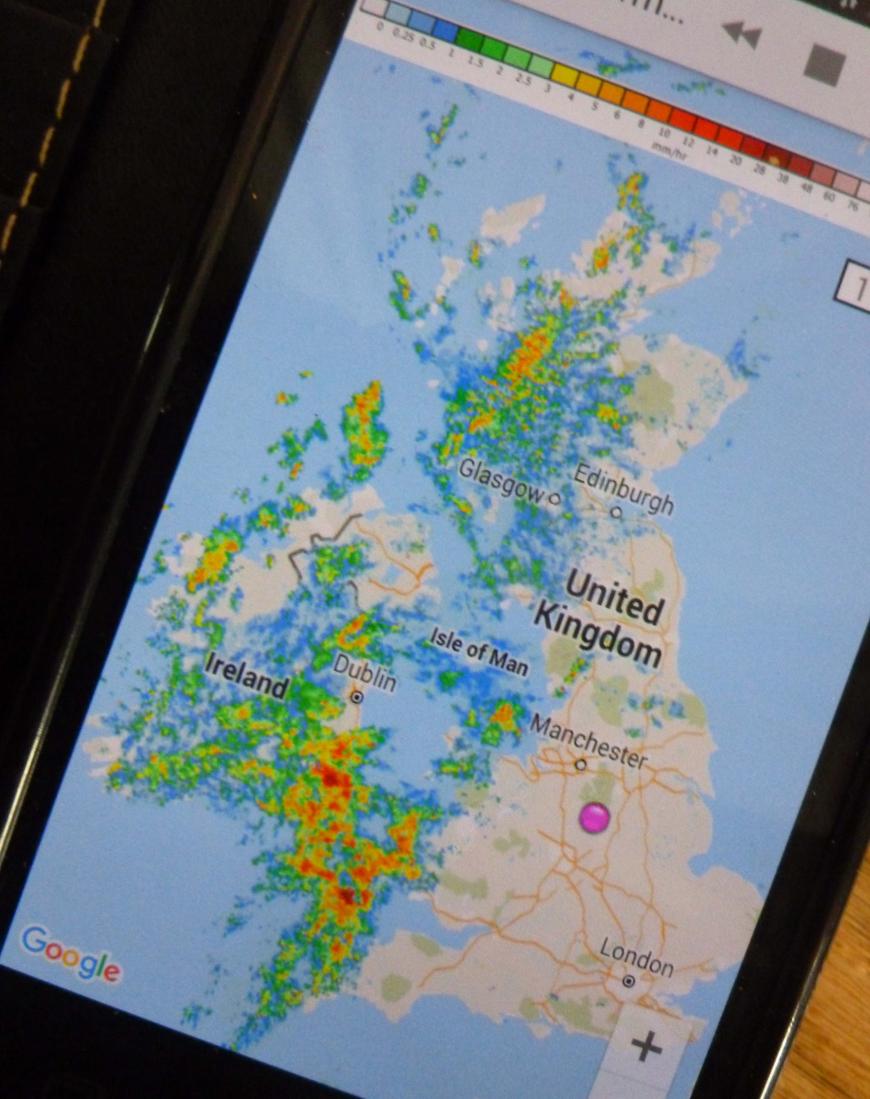
On the basic Radar version you can animate the rain to show how it is moving, add on lightning strikes (if there are any) add on the cloud satellite (InfraRed Sat or Visible Sat).
Following this syllabus might spark a long term interest in weather, it did for me. If you are going for the Scout badge, good luck. Do share your observations, rain gauges, cloud pics on our Twitter, Facebook or Instagram feeds.
Loading recent activity...