Welcome to the new ensembles viewer, from here you can view both the ensemble maps and graphs. To view the maps, just select a map option from the left hand menu, you can change the timeslot you view by dragging the slider or clicking the << and >> arrows. To view graphs (which cover the entire run, so changing the timeslot will have no effect), you need to select both a graph type and a location from the two menus on the right hand side.
Welcome to the new ensembles viewer, from here you can view both the ensemble maps and graphs. To view the maps, just select a map option from the left hand menu, you can change the timeslot you view by dragging the slider or clicking the << and >> arrows. To view graphs (which cover the entire run, so changing the timeslot will have no effect), you need to select both a graph type and a location from the two menus on the right hand side.
Upgrade To Netweather Extra
Access our new multi-model chart viewer, a huge range of UKV, Netwx (WRF-NMM) charts, MOGREPS UK graphs, EPS graphs, and much more. Click Here To Subscribe Today


 NetWx Model
 GFS
GFS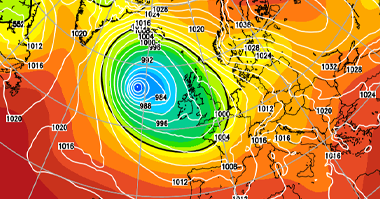 ECMWF
ECMWF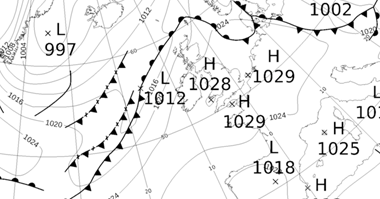 Fax
Fax
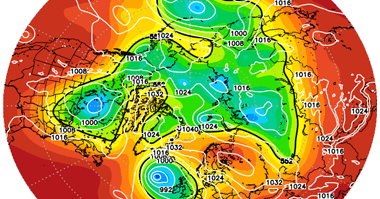 ECMWF EPS
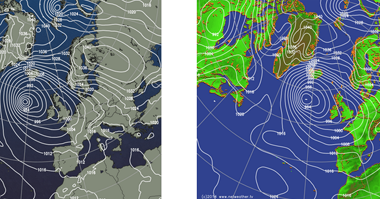 Comparison