
You may have seen headlines or images showing how air pollution has fallen during lockdown around the world in these times of COVID19. However, that is only half the story. Nitrogen Dioxide levels linked to the burning of fossil fuels: coal, oil and gas (in-vehicle combustion engines and power generation) have plummeted. The sudden reduction of NO2 has been dramatic, particularly in areas such as valleys and plains with large cities where the NO2 can build up and stagnate.
In London, some of the NO2 values have fallen by around 40% in addition to the recent anti-pollution measures such as the ULEZ, in York down 30%. The lockdown maybe creating pollution headlines, but a few months of less traffic isn’t going to make much different long term to the climate or the health of people’s lungs.
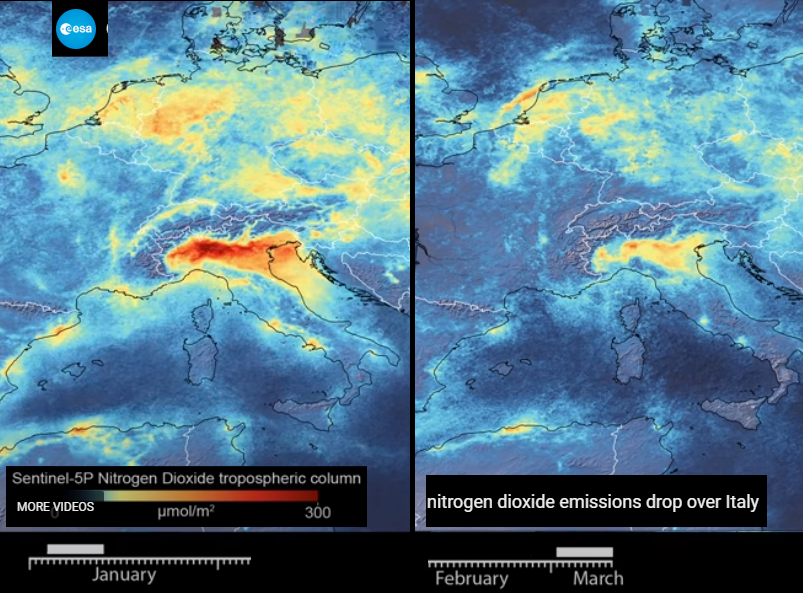
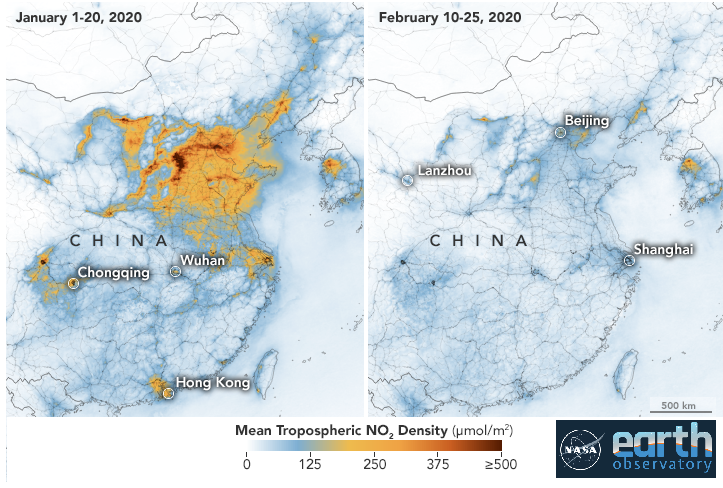
Numerous people have shared on social media two images of smog/no smog over China or northern Italy heralding “isn’t it amazing how air pollution has fallen so much in lockdown”. And yes, there has been a reduction but its temporary, values do vary through the year anyway and here in the UK, other pollutants have been at moderate levels this month. So, air pollution has not gone away.
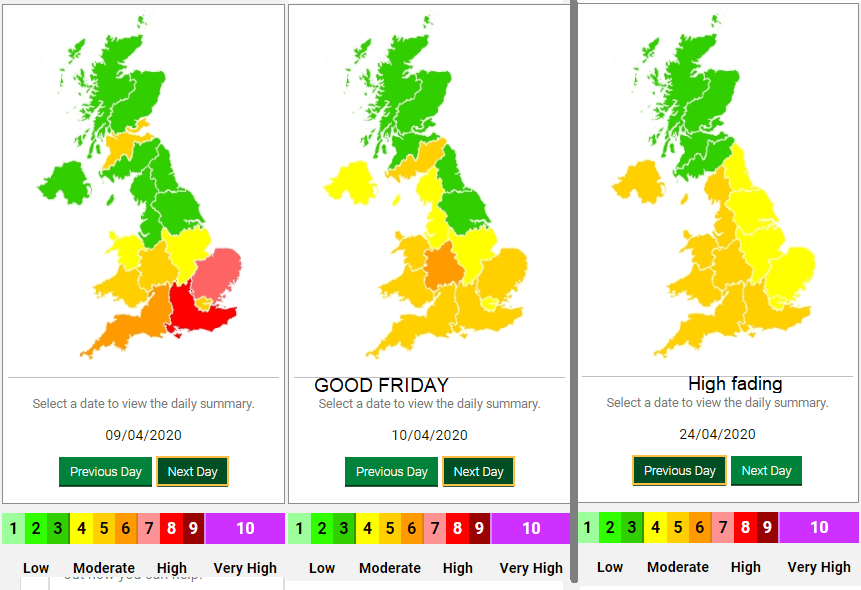
This was the writeup of a recent pollution episode by London Air over Easter weekend.
Weds 8th April - Fri 10th April, London and south-east England experienced widespread air pollution with a large number of monitoring sites breaching the threshold for 'Moderate' particulates. This episode was driven by air recirculating at low altitudes over the near continent and the Channel and resulted in a sustained import of particulate pollution.
The chemical signature of the particles detected indicates that the dominant pollution sources were a combination of emissions from agriculture, transport and industry. The current transport restrictions and the temporary closures of many businesses may have helped to avert a widespread ‘high’ particulate episode. An additional consequence of the reduced emissions from traffic is that ozone concentrations are higher and longer lived than we normally experience at this time of year. (This) Ozone episode lasted for five days, to the end of Sunday 12th April.”
Understanding where more pollutants come from, how they are created, their sources and how they are moved in our atmosphere will allow us to think beyond the traffic issue, significant as it is and to consider a bigger more complex picture.
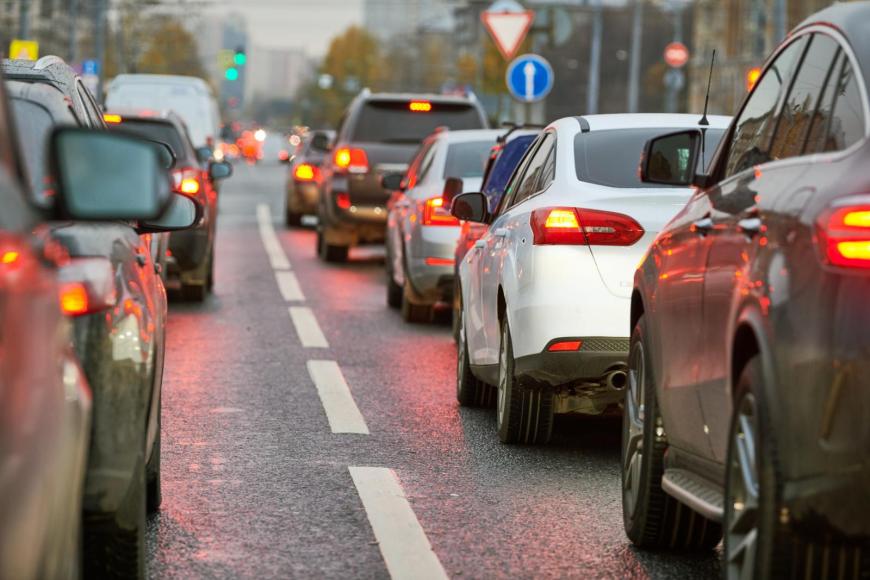
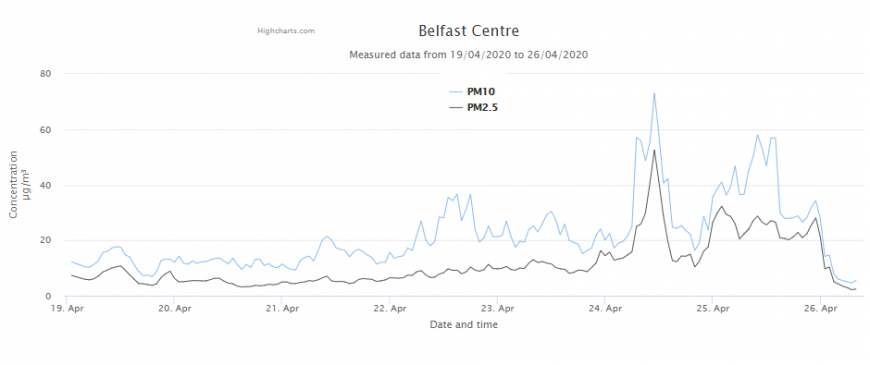
NO2 is only one pollutant. Walk along any rush hour street and it is there, obvious and choking. With this major pollutant reduced we can concentrate on other sources and there have been episodes in April 2020 of moderate, even high, values of other types of pollution. Of surface Ozone (a secondary pollutant formed by chemical reactions in sunlight) and Particulate Matter (PM) from gas heating, burning and agriculture.
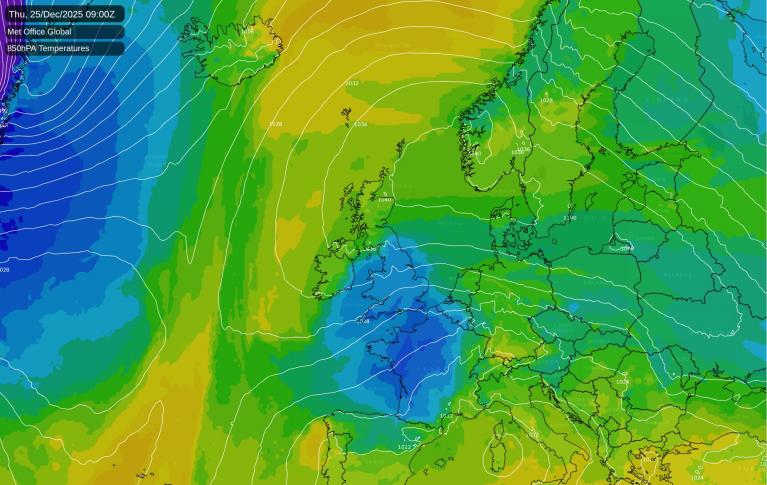
Weather: Our UK lockdown weather has been steady. It’s been dry, sunny, often blustery from the east and steered by lingering anticyclone.
"With particle pollution able to stay in the air for days, where our air has come from is crucial but we can't change nor blame the weather it is only the emissions that are within the gift of humanity to control." Dr Gary Fuller London Air
The weather patterns are important but not to blame. The wind direction is key but also if it has been wet or dry. With high pressure over Scandinavia for weeks this spring, northwest Europe has been very dry and easterly winds have brought air from central/northern Europe across to the UK. Before we leap to the “it’s foreign pollution invading our skies” we produce our own pollution which in our usual prevailing SW wind would head to Scandinavia and northern mainland Europe.
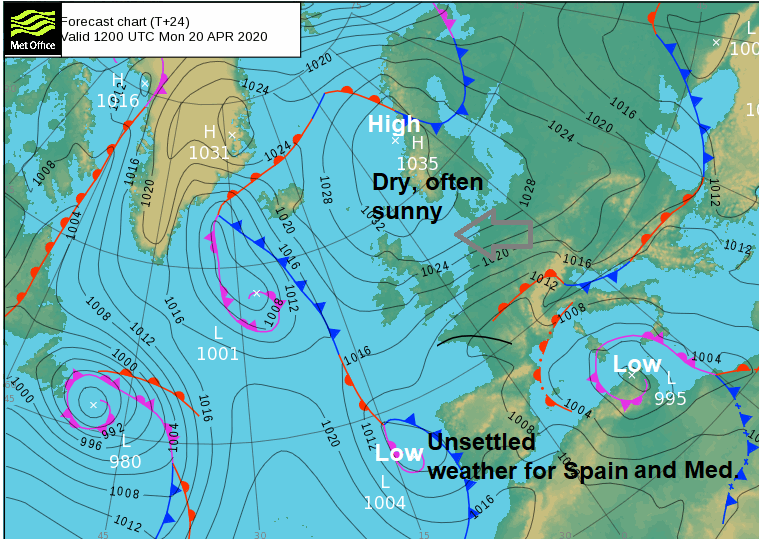
In these kinds of setups, there is lengthy, settled dry weather which allows particles to build up in the lower atmosphere. You can often see the haze as aerosols remain suspended, not washed out by rain and in the slowly descending air, when surface winds are light, we begin to see PM levels rising. As soon as the winds switch to the west or southwest and the Atlantic low pressure take over then dispersal takes hold and levels return to low. The springtime temperature is also important in how some of these chemicals behave. Allowing the reaction, the transformation to particulate matter. There are seasonal farming inputs and the increasing issue of wildfires but during this time of widespread lockdown, there is an opportunity to think about other data that would usually be mixed up with by NO2 pollution.
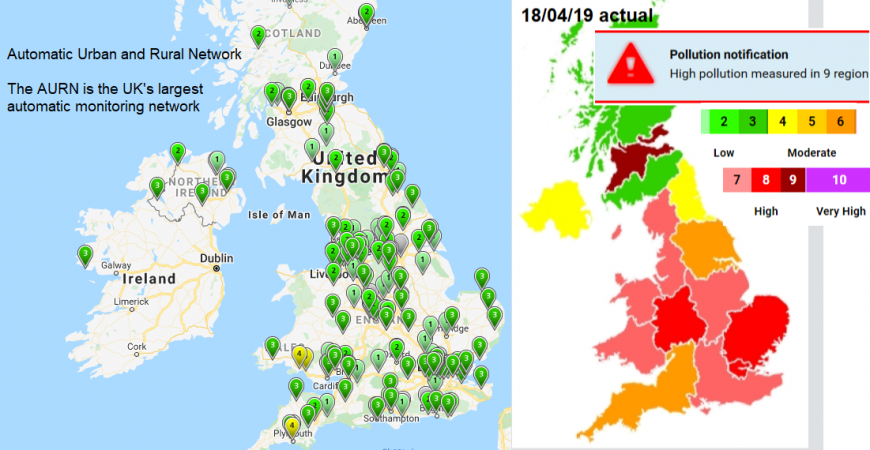
Data is gathered from above by satellites with sensors pointing at the earth’s atmosphere such as the Tropospheric Monitoring Instrument (TROPOMI) on the SENTINEL satellite, part of the European Copernicus Programme. This monitors NO2, Ozone and aerosols such as smoke particles from wildfires. At the surface there is closer monitoring, you may have seen roadside air quality stations.
"The UK network of automatic air quality monitoring stations measures oxides of nitrogen (NOx), sulphur dioxide (SO2), ozone (O3) and particles (PM10 and PM2.5). These sites provide high-resolution hourly information which is visible to the public." DEFRA
Air quality monitoring has grown in significance for cities, countries and the world. There is a school of thought that the air pollution data should be included in the everyday weather forecasts, as pollen and UV values have been. Why not? We warn for severe weather such as gales and snowfall, heavy rain which leads to flooding. High levels of air pollution could also be highlighted to warn vulnerable people to stay inside (after lockdown) or not exercise on poor air quality days.
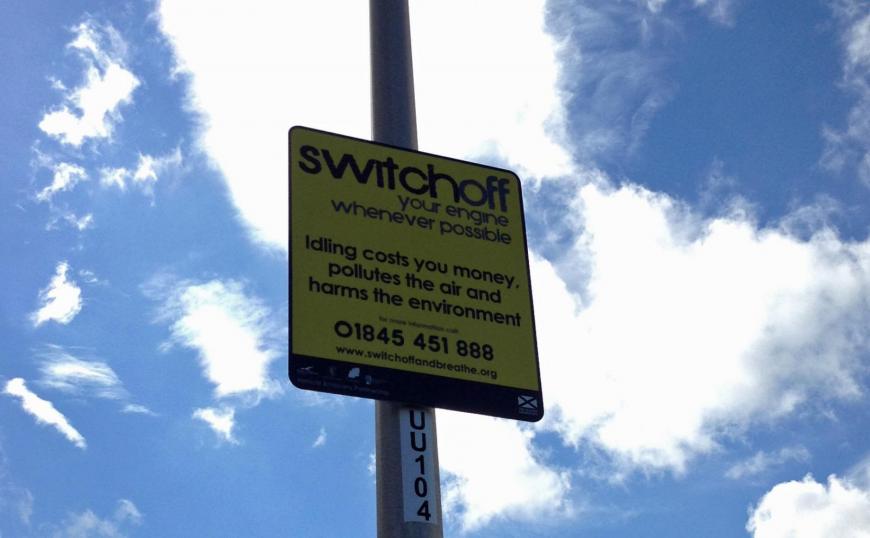
NO2 - “Nitrogen dioxide (NO2) and nitrogen oxide (NO) together are usually referred to as nitrogen oxides (NOx = NO + NO2).” Even with ULEZ and non-diesel cars, NO2 has been a big issue here in the UK. There is still a significant number of diesel-powered vehicles and large numbers of journeys made each day with congestion in towns and cities part of every weekday life. The fall in NO2 values in London is a result of fewer people travelling to work in lockdown but also the vehicles that are moving about are not stopping and starting, they are able to freely move on the roads. It is the crawling and idling which hikes up the pollution values. Agricultural fertilization adds NO2 into the atmosphere. Nitrogen dioxide inflames the lining of the lungs and brings an increased likelihood of respiratory problems.
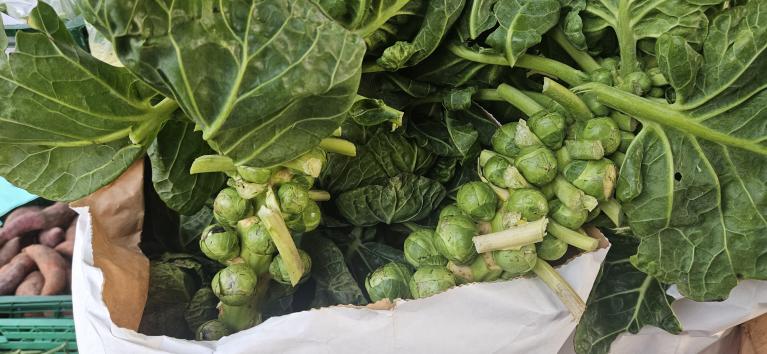
Nitrogen containing compounds (NO2, NO, NH3, N2O) get into the atmosphere from farming activities. Farmers want the nitrogen in the soil, helping the grass for cattle and on crops, not wasted by going into the air. However, manure spraying and fertilisers are significant in air pollution numbers. Ammonia forms particulate matter and can travel across Europe.
Ozone Ozone (O3) is an important part of the earth’s atmosphere, high up in the stratosphere (where we hear talk of a hole in the Ozone layer) and in the troposphere lower down. At high concentrations at the surface, it is harmful to health. Sunlight falls on a mixture of photochemical oxidants in the air and Ozone forms, with Motor vehicle exhaust fumes being a key ingredient. It follows a strong pattern of buildup during the day as the sun gets stronger. It can be transported long distances from source. Ozone can irritate the lining of the nose, airways and lungs.
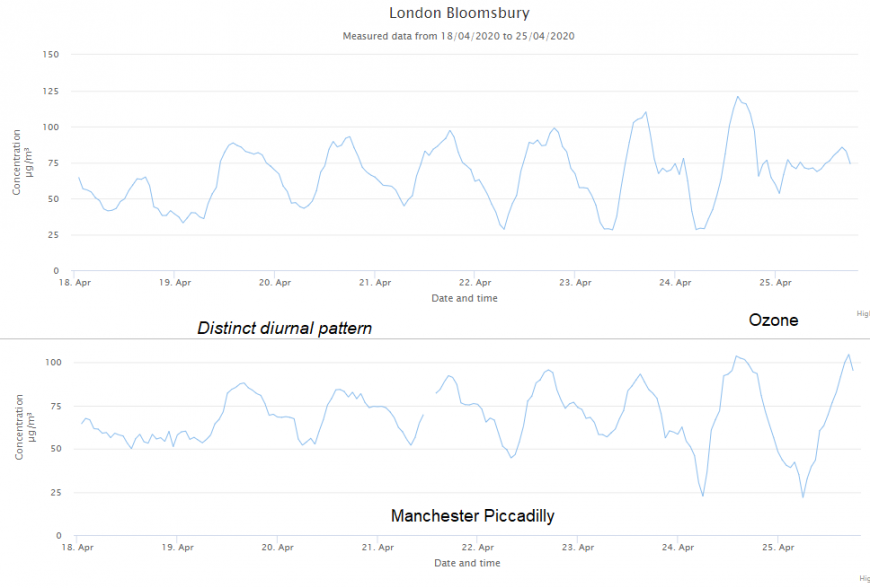
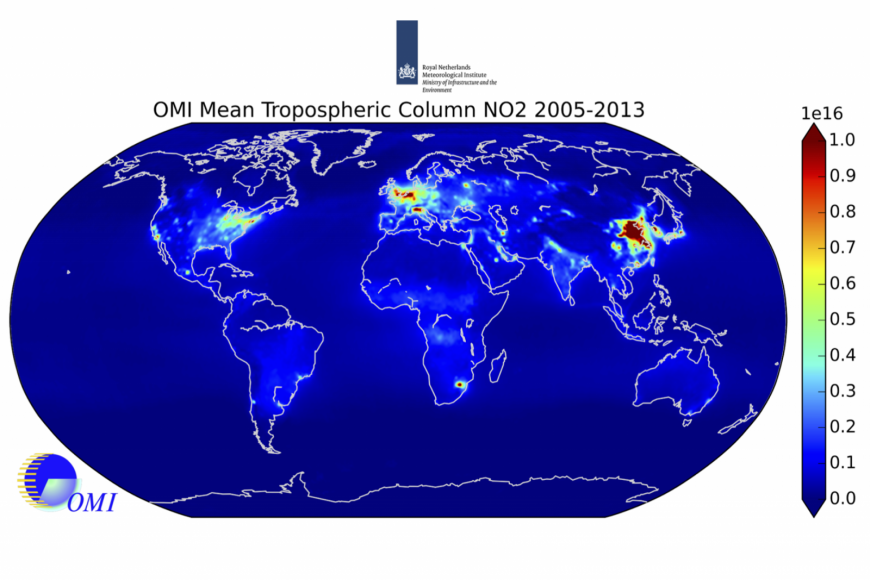
One intriguing nuance is that usually, in the presence of sunlight, Ozone converts NO to NO2 and vice versa, it takes up spare oxygen. Ozone is a secondary pollutant, it is produced by reactions of other pollutants in the air and in places it is scavenged, reduced, by exhaust emissions. However, there is not enough traffic at the moment so the O3 builds up. This has long been a worry as NO2 pollution is tackled, that the Ozone values would rise. Worldwide Nitrogen dioxide can easily be measured by satellite although allowances have to be made for cloud cover.
Particulate Matter PM
Airborne particles are sometimes referred to as 'particulate matter' or 'PM'. They include dust, dirt, soot, smoke, and liquid droplets. Natural sources include bushfires, dust storms, pollens and sea spray. Different sizes of particles are measured with the smaller PM2.5 begin of more concern as they can travel deeper into the body. The recent dry and blustery weather will have introduced dust and fine soil into the atmosphere and with wildfires breaking out with the lack of rain, the setup has encouraged more particles in the air. Some peaks in PM readings can be traced to wildfire smoke nearby or back further downwind. Vehicle emissions again are a source and transport such as brake wear, industrial processes and burning including domestic wood-burning stoves. All reduce visibility, under an anticyclone with trapped air a haze can develop. Particle pollution links to respiratory illnesses (such as asthma and bronchitis) and cardiovascular disease, with some components causing cancer.
Yes, some air pollutants have decreased, NO2 levels have fallen dramatically with less traffic and less manufacturing but Ozone has increased, and the particulate matter continues to be an issue as it often is at this time of year. The long-term impacts of air pollution on people’s health is significant, particularly for children. WHO says "Air pollution kills an estimated seven million people prematurely worldwide every year".
In a pandemic with a virus which can affect the respiratory system, people don’t need anything working against them. Studies continue around the world, investigating possible links of many factors to COVID19 deaths.
https://twitter.com/WMO/status/1136221389797711873
However, as thoughts turn to life after lockdown, as we continue to social distance, maybe work from home and keep up our daily exercise these experiences should bring forth changes and so help with longer-term pollution levels. The campaign #SpaceforDistancing is highlighting how pedestrians and cyclists need extra space on roads, and so from traffic, to comply with the 2m rule. If more weight is given to other road users, more space so they don’t inadvertently step out in the road and get run over as car use returns, then maybe the NO2 levels don’t have to completely bounce back to where they were.
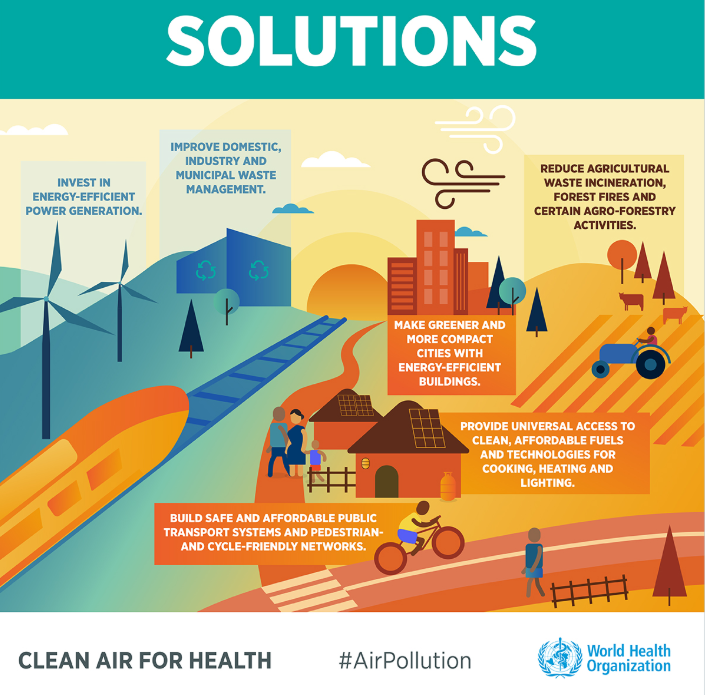
The Netherlands and Denmark have new farming policies and practices to reduce their ammonia emissions. Anywhere, not fertilising until the weather is right will cut down on the amount wasted but whilst there is a high demand for beef, intense farming will continue. England has passed a new law to restrict what can be burned on wood stoves and open fires, wet wood and coal. Tackling air pollution and climate change has seen almost impossible, too huge. The changes to our lives in recent weeks have been bizarre. Maybe it’s a good time to make other significant changes for the climate?
Air pollution monitoring in the UK; types, sources and effects
Wild Fires divert Fire and Rescue teams from COVID response in dry and windy weather.
Loading recent activity...


