Successive areas of low pressure moving in off the Atlantic bringing changeable and often unsettled conditions are expected during the first half of the month. So, most days will likely feature showers or longer spells of rain across many areas, with some heavy rainfall at times, with an increasing risk of flooding, especially across the west. Periods of strong winds are also possible, perhaps strong enough for one or two storms to be named affecting the UK. Temperatures generally around or a little above average, any snow confined to northern hills during colder polar maritime incursions behind lows clearing.
The second half of the month we think either a continuation of unsettled conditions off the Atlantic for much of the time, but also a greater potential for blocking high pressure developing and having more influence at some point, bringing more settled conditions for some or all parts of the UK for a time, which may bring a greater chance of colder conditions too, with risk of frost and perhaps wintry precipitation.
Probability for temperatures against 1991-2020 average: 50% of chance for above average, 30% chance of average, 20% chance of below average.
Probabilities for rainfall: 60% chance of above average, 30% chance of average or 10% below average.
High pressure systems could be more dominant than December during the month, thanks to a weaker than normal polar vortex, which could still be susceptible to a SSW, and a wavier jet stream, bringing calmer and drier weather and average temperatures. Cold snaps are possible, but very dependant on the positioning of high pressure, colder weather more likely in early January, which corresponds to typical La Niña winters, where initial cold snaps are followed by a milder trend in the second half of winter. There could be a tendency for more changeable and sometimes unsettled conditions later in the month, as westerlies return with areas of low pressure moving in off the Atlantic.
Probability for temperatures against 1991-2020 average: 50% chance of average, 30% chance of above average or 20% below average.
Probabilities for rainfall: 40% of chance for average, 30% chance of above average, 30% chance of below average.
Changeable and often unsettled conditions are favoured across northwest Europe for much of the month. This means spells of rain or showers will be frequent, with very wet and windy weather at times, with an active jet stream and low pressure systems moving off the Atlantic over or near the UK. However, a spell of high pressure with more settled and perhaps colder conditions can't be ruled out, particularly later in the month, but generally it's looking an unsettled and mild month. Overall, milder-than-average and wetter-than-average conditions for the whole month.
Probability for temperatures against 1991-2020 average: 40% chance of above average, 30% chance of average or 20% below average.
Probabilities for rainfall: 50% of chance for above average, 40% chance of average, 10% chance of below average.
Continue below for the in depth forecast and explanation of the factors which are expected to influence the weather this Winter.
It's that time of year again when we try to figure out what to expect for the upcoming winter. A seasonal forecast at any time of year is always tricky. But the winter forecast is the most difficult because you have far more factors to consider than in other seasons. When creating a seasonal forecast for the warm season (Spring and Summer), the primary forcing mechanisms or drivers are from the tropical regions so that one can focus on the state of ENSO. However, in the cold season months, one must consider various factors outside of the tropical regime like the Stratospheric Polar Vortex (which is absent in summer), the transport mechanisms between the tropospheric mid-latitudes and the stratospheric high latitudes, movement of stratospheric winds, and how all of these factors interact with each other.
The winter forecast looks at a range of data including weather model seasonal forecasts, current and recent weather patterns in the northern hemisphere, tropical forcing over the Pacific, tropical stratosphere winds, solar cycle, and various teleconnections are considered. Based on some of the drivers that can be predicted to remain in a similar state through the season, we also use analog years where certain drivers were in a similar state in past winters too. We consider all this data to try and come up with an idea the most likely patterns that will prevail during each winter month. However, confidence in how the weather will behave in detail more than a few weeks away is low, even more so two months or more away. So after a few weeks we can only give a broad idea of what patterns we think may dominate and whether it is more likely to be milder/colder or drier/wetter than average. We can't say what the weather will be doing specifically during a particular week more than 2 weeks away.
With global warming, a milder-than-average winter is becoming the form-horse, so forecasting any potential for colder conditions is becoming even more difficult.
While 2025 may not be the hottest year, it is almost certain to rank in the top three.
According to the latest Copernicus Monthly Climate Bulletin:
The year 2025 may fall just a few hundreds of a degree short of 1.5ºC above the pre-industrial average, however the average global temperature for the past three years (2023-2025) is likely to exceed 1.5ºC. It will be the first time the 1.5ºC threshold would be exceeded for three consecutive years.
The North Atlantic is widely anomalously warm, apart from off the coast of NE USA and Canada Maritimes. All this background extra warmth will make it an uphill battle to get colder than average conditions across an island surrounded by warm waters. Northerly winds will blow, easterly winds too, so it will turn cold occasionally, but it is an increasingly uphill battle in recent years to get a below-average month with large-scale maritime warmth.
Also, arctic sea ice is rapidly declining. On average, the Arctic has lost an area of 71,000km2 of sea ice per year in summer and 31,000km2 per year in winter since 1979. Arctic sea ice levels are currently significantly below the 1981-2010 average, with a new record low maximum extent set in March 2025. Throughout much of 2025, sea ice extent has been below average, particularly in regions like the Atlantic side of the Arctic, which means arctic air moving south will less cold than it used to be, with more ice-free sea to cross.
The clues to build the winter forecast mostly come from trends in numerical models, atmospheric drivers and analogs. We develop our winter forecast based on these 3 main tools used together to best estimate pressure and temperature anomalies over Europe.
Why use all 3 parameters? Numerical models and analogs are regularly used for seasonal trends across all seasons. However, the atmospheric drivers generally become important in mid-autumn until March. Indeed, they are effective when certain patterns begin to clearly emerge that seasonal models issued monthly may not have picked up on, so it is therefore easier to identify changes in indices which could have a knock-on effect for the rest of the winter.
There are a number of models that produce seasonal outlooks, European ECMWF, UK Met Office and American NCEP are the main ones to look at and they update around the 10th of each month, so we will look at those to try and build a picture and also at the cross-model blend to see if there's any consensus.
The main meteorological drivers which can influence weather patterns through the winter that will be discussed are the QBO (Quasi Biennial Oscillation), solar activity, ENSO (El Nino Southern Oscillation), Madden Julian Oscillation (MJO), North Atlantic Sea Surface Temperatures (SSTs), Northern Hemisphere snow extent and more. One of the most influential drivers is the El Nino Southern Oscillation (ENSO), the warming or cooling of the central and eastern tropical Pacific, which is one of the most important climate phenomena on Earth due to its ability to change the global atmospheric circulation, which in turn, influences temperature and precipitation across the globe.
This tool helps to see if there could be a recurrence of anomalies in Europe for a defined period of time, in the case of the winter outlook – each of the three winter months. From archived data we can produce composites of analog winter months where indices such as ENSO phase and QBO phase were similar to what are forecast for the forthcoming winter.
The C3S multi-model 500 hPa heights for each of the 3 winter months shows higher heights / blocking in December, January & February both featuring lower heights to the NW of Europe, higher heights over Europe – a typical +NAO pattern. Temperatures for in December ranging between 0.5-2C above average, for January and February 0.5-1C above average. Precipitation average for England and Wales all 3 months, slightly above for Scotland.

Of the various seasonal model output - we'll focus on ECWMF, NCEP & UKMO.

500 hPa heights (above): December - higher heights to the north of UK, lower heights SW Europe – Azores, suggests southerly tracking jet with increased chance of colder weather. January – lower heights to west of Europe, higher heights over N Europe, mixed mild/cold potential. February – lower heights to the NW – mild pattern.
Temperatures: Dec – average in the south, above in the north. Jan & Feb – mostly above average (+0.5-1C)
Rainfall: slightly drier than average for the north in December, average in the south. Otherwise, January and February looking average.

500 hPa heights (above) - Westerly flow dominant all 3 months, with lower heights towards the NW and higher heights over Europe. Strongest +NAO signal of all models for all 3 months.
Temperatures – above average all 3 months: Dec and Feb 1-2C above, Jan 0.5-1C above.
Rainfall – average to slightly wetter than average for all 3 months.

500 hPa heights (above). Dec – higher heights close to west of UK. Jan – low heights close to west of UK, higher heights over eastern Europe. Feb – low heights closer to Iceland / Greenland, higher heights over western Europe.
Temperatures: Above average all 3 months
Rainfall: Dec - Slightly drier in the south, average north, Jan & Feb around average.
This is by far the best-known atmospheric driver, which many have heard of. The El Nino Southern Oscillation is a measurement of the deviation in sea water temperatures in the tropical Pacific Ocean, between South America and Asia.
La Niña occurs when below-average sea surface temperatures (SST) develop in the central and eastern tropical Pacific Ocean. In general, the cooler the ocean temperature anomalies, the stronger the La Niña. El Nino is the opposite of La Nina – with above-average sea surface temperatures (SST) in the central and eastern tropical Pacific Ocean. Over Indonesia, rainfall tends to become reduced while rainfall increases over the central and eastern tropical Pacific Ocean.
The rising air in association with the enhanced thunderstorms of where the warmer waters are during El Nino or La Nina, in turn strengthens the Hadley Circulation – where air rises near the equator, spreads towards the poles, then sinks back to the surface in the subtropics. This changes the position and strength of the jet stream in the mid-latitudes which in turn affects weather patterns in North America and Europe.
A neutral ENSO is when tropical Pacific SSTs are generally close to average. However, there are some instances when the ocean can look like it is in an El Niño or La Niña state, but the atmosphere is not playing along (or vice versa).
La Niña conditions have developed this autumn, signalled by a cool sea surface temperature anomaly signature currently present across the Eastern Equatorial Pacific Ocean.

La Nina has been the dominant player in the tropical Pacific during four of the five winters this decade with colder-than-normal sea surface temperatures persisting during these seasons.
La Niña usually promotes a strong blocking high-pressure system in the North Pacific, and a low-pressure area over Canada. This redirects the polar jet stream down into the northern U.S., allowing cold incursions into the central and eastern United States – which in turn drives a strong jet stream over the North Atlantic towards Europe.
However, forecasts are for a weak La Niña episode through winter, with sea surface temperature anomalies between -0.5ºC and -1.0ºC (a strong episode would involve anomalies of -1.5ºC or greater for 5 consecutive months).
Also, long range models indicate this will only be a brief La Niña episode with conditions trending to neutral sometime between January and March.

Research shows that the ENSO, in collaboration with the Quasi-Biennial Oscillation (QBO), that will be explained later, has a major influence on the chances of stratospheric warming occurring during the winter. In the event of a weak La Niña in combination with an easterly QBO there is an increased chance of a Sudden Stratospheric Warming SSW – which can lead to high latitude blocking and greater risk of colder weather.
The North Atlantic in October showed above average SSTs for 74% of the area (between 0ºN and 60ºN) mostly mild except in the western region around Newfoundland. October 2025 was the 5th warmest October month on record.
The Arctic region shows large above-average temperature -reaching more than 2ºC above average. As already mentioned, arctic sea ice levels are currently significantly below the 1981-2010 average.
The combination of warm Atlantic SSTs and the lack of sea ice in the polar regions to the north with likely modify cold air arriving from polar regions more than it used to, while maritime flows from the west or southwest will generally be warmer too.
The polar vortex is a large area of low pressure and cold air surrounding both of the Earth's poles. It always exists near the poles but weakens in summer and strengthens in winter. The term "vortex" refers to the counterclockwise flow of air that helps keep the colder air near the Poles. During winter in the northern hemisphere, the polar vortex will expand, sending cold air southward with the jet stream, which is often associated with large outbreaks of Arctic air being sent southwards into Europe, northern Asia and North America.
The North Atlantic Oscillation (NAO) is measured as the pressure difference between the Azores and Iceland and thus the strength of the westerly flow over the North Atlantic. If the NAO index is positive, the westerly circulation is stronger than usual. With a negative NAO index, the western circulation is weaker than normal, which increases the chances of cold winter weather in the UK.
During December and the beginning of January, the stratospheric Polar Vortex (SPV) is forecast to be weaker than average. This can mean that is more susceptible to sudden stratospheric warming (SSW) which can displace or split the vortex, bringing a greater chance of high latitude blocking. However, the stratospheric polar vortex (SPV) is not always coupled with the tropospheric polar vortex (TPV), as appears to be the case as we head into the start of winter, so this continuing disconnect allows the troposphere to continue on its own path for now, with the TPV looking to be based over northern Canada early December, while the SPV looks to be displaced toward the Barents Sea by a current stratospheric warming. But there is potential that there maybe coupling between the stratosphere and troposphere later in winter.


The NAO will be in a positive phase during the start to December, which means Atlantic low pressure will be dominant to the northwest while pressure is high over the Azores, with areas of low pressure off the Atlantic affecting the UK.
A tropospheric polar vortex (TPV) to the northwest of UK & Ireland is forecast to be a persistent feature this winter, however its influence over NW Europe could wax and wane during the first half of winter. When the TPV trough extends towards NE Atlantic – it will likely extend and strengthen the North Atlantic jet stream towards NW Europe – bringing low pressure close to NW Europe and high pressure over central and southern Europe. When the TPV axis retrogrades back into eastern N America, the jet stream will likely retract and increase the chances of high pressure building over NW Europe or Scandinavia, while low pressure could develop over southern and eastern Europe. The timings of when this happens are very difficult to pinpoint for a whole season.
We have discussed how the polar vortex can influence the NAO and thus our winter weather. It has been known for some time that the temperature in the stratosphere has a major influence on the NAO. In the winter months there often appears to be a high degree of 'coupling' between the troposphere (the lowest air layer of the Earth) and the stratosphere (the air layer above it). A 'Sudden Stratospheric Warming' can occur most winters or every other winter which can weaken the stratospheric Polar Vortex through vertical wave movements occurring in the Northern Hemisphere during the winter. This is where movement of air from the troposphere reaches the stratosphere, causing air to accumulate in the stratosphere, causing warming and a high-pressure area in the stratosphere. As a result, the stratospheric Polar Vortex, which is normally very strong and with strong westerly winds in winter, is seriously disrupted, causing a reversal of stratospheric winds to easterly.
The zonal winds in the polar stratosphere at 10 hPa 60 degrees North briefly reversed (turned negative) in the last few days of November. If the zonal winds reversed (fell below 0 m/s) for 24 hours, then it would be technically a SSW, so this could be one of the earliest SSWs on record, they are very rare in November.

However, this SSW looks to be of reflective type, reflection of planetary waves upwards into the stratosphere look to be reflected back down into the troposphere, leading to a quick termination of the warming episode due to the reflection of planetary waves in the stratosphere, which leads to an amplification of tropospheric planetary waves inducing strong westerlies over the North Atlantic and blocking over the North Pacific sector.
The other type of SSW is the absorbing type, which you may be more familiar with, where upward planetary waves are absorbed in the stratosphere leading to a strong deceleration of westerly winds in the upper stratosphere - with a disappearance in the polar night jet. This weakening of zonal (westerly) winds descends from the lower stratosphere further down into the troposphere - which then induces high latitude blocking in the weeks following the SSW event. This can increase the chance for cold outbreaks to develop over northern Europe and USA, as cold arctic air is pushed out from the polar regions by the high latitude blocking.
Although zonal stratospheric winds look to recover and strengthen after briefly reversing in late November, they are forecast by ECMWF to stay weaker than average, while means shows another decrease around 23rd Dec, so we can't rule out another attempt at a SSW in late December or early January too.
This fits with the tendency for there to be a greater chance for a SSW in winters featuring La Niña and easterly Quasi Biennal Oscillation (QBO). We will discuss later how La Nina combined with the QBO and maximum in the solar cycle and QBO can increase the chances of a SSW.
We are currently approaching the solar maximum phase for solar cycle 25, solar activity is expected to remain on the high side during this winter season which tends to be more unfavourable for high latitude blocking events than during low solar activity, but this alone doesn't prevent these events happening. Low solar activity years historically led to higher heights on average over Greenland/Canada/Iceland. While the opposite holds true during high solar activity years with a lack of high-latitude blocking.
The QBO refers to upper atmospheric trade wind patterns in the tropics, which in turn have an influence on global weather patterns. Around the equator there is a jet stream in the upper air, which changes direction every so often (from 'westerly' to 'easterly' and vice versa). The Quasi-biennial Oscillation or QBO describes the wind component of this jet stream and its strength. If the QBO is negative, the jet stream is easterly. And if the QBO is positive, then the jet stream is westward.
The QBO fluctuates between an easterly and a westerly phase approximately every 13-17 months, and the magnitude of each phase varies from year to year, with stronger magnitude phases having a greater influence on northern hemisphere winter weather patterns.

This winter will see a descending strong easterly phase of the QBO, which tends to favour a weaker polar vortex, on average, through the winter. This signal is amplified during weaker La Niña episodes. Easterly QBO phases combined with weak La Nina episodes can favour more frequent polar vortex disruptions and a higher chance of Sudden Stratospheric Warming (SSW) events, which can lead to cold spells for parts of northern Europe and North America.
The MJO is a large-scale coupling between atmospheric circulation and tropical convection. It differs from ENSO in being a travelling pattern across the warm tropical oceanic areas of the globe rather than the standing pattern of El Nino / La Nina over the tropical Pacific. It is characterised by an eastward progression of large regions of either enhanced or supressed tropical rainfall, this anomalous rainfall area is mostly evident over the western Indian Ocean, then the warm tropical western and central Pacific as the MJO progresses eastward. The MJO wave of enhanced or supressed tropical rainfall is usually less evident when it moves over the eastern tropical Pacific and tropical Atlantic. The enhanced areas of rainfall or convection are followed by a dry phase when convection or thunderstorms are supressed – as the MJO wave propagates east. Each cycle of the MJO lasts about 30-60 days.
The strength and phase of the MJO can impact the location of the jet stream as well as the formation troughs and ridges. The MJO has far-reaching impacts on northern hemisphere extratropical weather through Rossby Wave propagation. The Rossby Wave propagation depends on the longitude of where the enhanced convection associated with the MJO wave takes place. As the MJO has a significant impact on northern hemisphere weather patterns, including the North America, Atlantic and Europe, there are correlations that can be made between the 8 different phases of the MJO and the lagged impacts on the upper air patterns that might be expected over the North Atlantic and Europe based on composites of previous events. The impact of the MJO on European weather is strongest about 10 days after the MJO is in phase 3 or 6, the probability of a strong +NAO is increased about 10 days after the MJO is in phase 3, but decreased 10 days after phase 6, with a probability of a -NAO increasing after MJO has passed through phases 7-8. However, the impact of the MJO on North Atlantic and European weather patterns depends on the strength of amplitude of the wave.
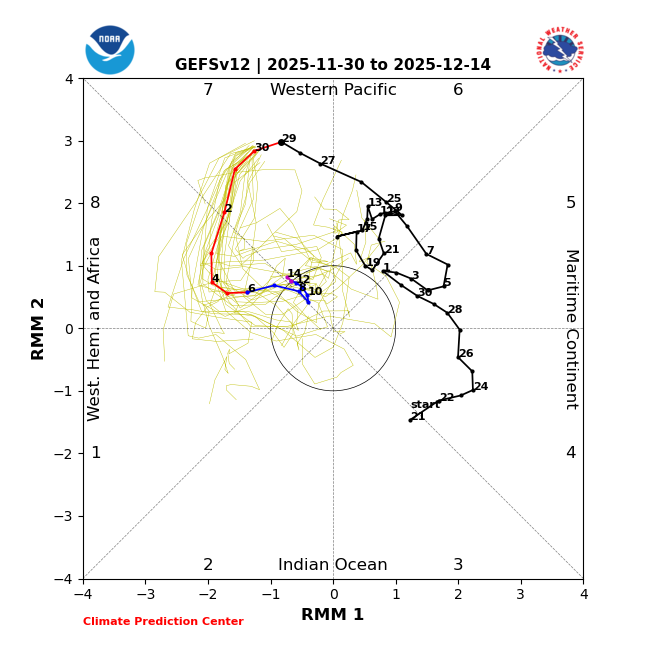
The MJO is currently over the western Pacific in phase 7 at quite a high amplitude, then forecast to move fairly quickly into phase 8 and weakening. A lag response to phase 7 of around 10 days is historically linked with an increase of blocking high pressure over northern Europe in December, particularly centred towards Scandinavia, as the composite below shows for phase 7 during La Nina. However, this doesn't always occur, with other drivers, such as a strong TPV dominating the North Atlantic overriding this forcing. While the MJO looks to quickly weaken in phase, with forcing becoming to weak to have much if any impact on mid-to-higher latitude patterns thereafter.

December 2008 stands out as the best analog month featuring MJO starting December in phase 7. That winter features as one of the winters used in the analogs, that December had the below 500 hPa heights anomaly:

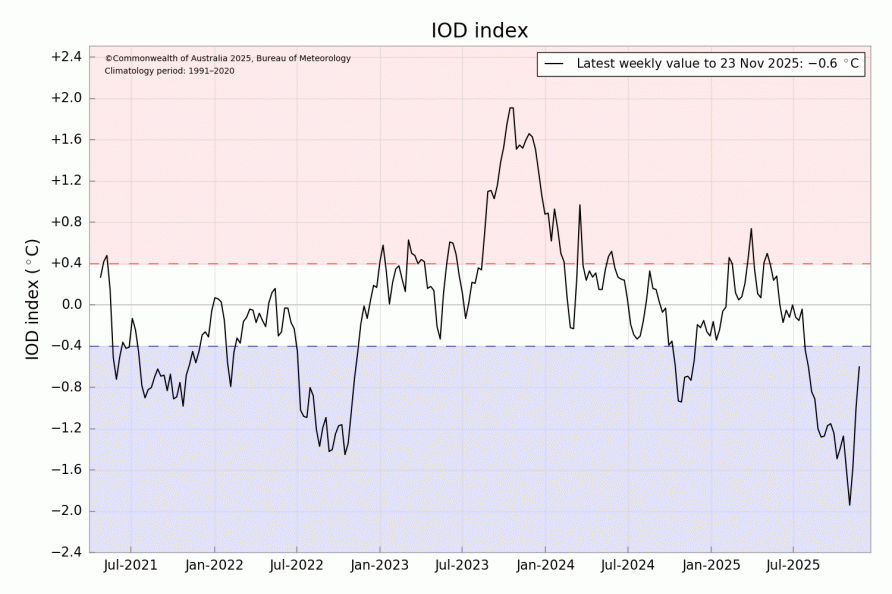
The last of drivers on weather patterns that has some value in the winter forecast: the Indian Ocean Dipole (IOD) index. The effects of this have only been properly mapped out in recent years. The IOD is the counterpart of the ENSO in the Indian Ocean. This also concerns SST differences between two areas of one ocean, this time, the Indian Ocean. In a positive IOD phase, the SSTs off the African east coast are warmer than normal, while the sea water on the other side of the Indian Ocean (near Indonesia) is colder than normal. In a negative IOD phase, the roles are exactly reversed.
The effects on winter weather patterns are as follows:
- With a positive IOD index, the chances of northern high-pressure blocks decrease and thus the chances of cold weather in Western Europe are lower.
- With a negative IOD index, the chances of northern high-pressure blocks increase and the chance of cold weather in Western Europe increases. The limit value to qualify an IOD as 'positive' or 'negative' is +0.5 and -0.5C respectively.
The negative Indian Ocean Dipole (IOD) event remains active but has been weakening steadily over the past three weeks. The latest index value is −0.60 ºC for the week ending 23 November. The Australian Bureau of Meteorology's model predicts a return to a neutral IOD in December. Due to the negative IOD index at the beginning of winter, there is, we think, a greater chance of high pressure blocks over northern Europe in late December and January. Later in the winter the IOD will no longer have any influence.
Analog winters since 1980 with weak La Nina, easterly QBO, + negative IOD some years: 83-84, 95-96, 00-01, 05-06, 08-09, 17-18, 20-21.
This produces a 500 hPa geopotential composite of those analog years as below for January and February. Will not use the composite of analog years for December, as using current model output is likely to be more accurate.


The composite of analog years above shows a theme for low heights over the UK in January, so unsettled and wet. The low height anomaly further south over mainland Europe and higher height anomalies to the north in February typical of a -NAO pattern, so wetter south and drier north, potential for colder episodes too from the east or northeast. This February composite goes against the main seasonal model's consensus of low heights to the NW and higher heights over Europe – typical of a +NAO.
For December we'll weigh heavily on current state of the atmosphere in the northern hemisphere, the sub-seasonal output from ECMWF along with most recent MJO forecasts from models for the forecast. For the second and third month of our seasonal forecasts, uncertainty increases greatly, so we rely on seasonal model output.
Seasonal models rely on predicting from their current state interactions between the atmosphere, ocean, land over long timescales (months to years) which are, to a certain extent, predictable. The most important of these is the El Niño/La Niña phenomenon, but also considering other drivers, that have been mentioned. The seasonal model output has a greater weight in making this winter forecast for January and February, but the composite 500 hPa heights of these months in years of similar ENSO state and QBO phases are also considered, but less so than the seasonal models.
Stay upto date with the long range forecast throughout the year with the Month Ahead Forecast - Updated Every Monday.