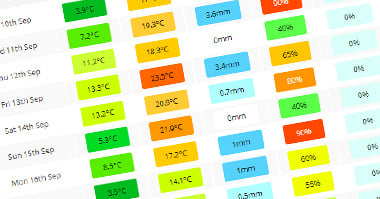
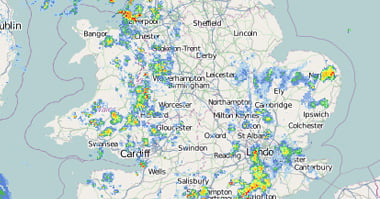
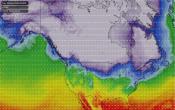
Updated four times a day the snow risk forecast maps, precipitation type maps and experimental snow depth maps are generated from GFS (global forecast system) data here at Netweather. Click the left and right arrows to cycle through the images in three hourly intervals or drag the slider to jump to a particular time. You can also animate the maps by hitting the animate button. The drop down menu allows you to select the chart type you would like to view.
Map Information Snow Risk - This map shows two items, the risk of snow (percentage) using the colour scale, and the likely height in metres that any snow is likely to fall to which uses contour lines. Precipitation Type - This uses the colour scale to show three categories of precipitations, rain (blue), rain/snow mix (green) and snow (pink). The darker the colour, the heavier that precipitation is forecast to be. Snow Depth - This is an experimental chart. It uses both colours and the black contour lines to show the forecast snow depth, with the red contour lines showing the expected height in metres of the freezing level. (0c isotherm).
Cookies On Netweather
Like most websites, Netweather uses cookies to enhance your experience of our site. Using this website means you're ok with that, but if you would like more information or to opt-out of cookies of please visit our Cookie Info Page