


Beanz
-
Posts
817 -
Joined
-
Last visited
Content Type
Forums
Blogs
Gallery
Events
Learn About Weather and Meteorology
Community guides
Posts posted by Beanz
-
-
On 02/03/2024 at 00:05, Don said:
Had the 'twists and turns' of the models led to cold spells properly materialising, then I would have agreed with this!
Some of us hang out here for weather, not just snow…
-
 2
2
-
-
Certainly been an interesting winter, the twists and turns of the models have been great fun this season, keeping us all on our toes.
-
WYorksWeather looking like the perfect start to a spring season - what’s not to like about those ensembles!
-
2
-
-
I always enjoy your measured posts Nick, they’ve been the ones to look forward to throughout this winter season. I think you’re right to call out the MJO.
Now that winter is drawing to an end, I think I can happily say it’s been a fun few months of model watching, and we’ve had the widest variety of weather I think I’ve ever known.
-
It’s been fairly windy here and more than I expected. I would say it probably just about warrants the amber warning in this area, and I’d expect some trees to be down for certain. The village is currently without power so something somewhere has blown over.
-
 1
1
-
-
Well, even the frost has been disappointing this week - barely a frost on the windscreen this morning
-
1
-
-
1 hour ago, pinball wizard said:
Have to say the AI Graphcast model has been performing reasonably well over the last 5 days that I've been following it. Though we're not yet at Wednesday it does seem to have handled the will it wont it low to the south quite well too. For those not familiar with it here is the link:
Forgive my flippant question, but how do you know if AIG has modelled a low pressure system well, if it hasn't happened yet...?
-
3
-
-
- Popular Post
- Popular Post
2 minutes ago, Jason T said:Blimey' reading through the last 5 pages I'm more confused now than when I started reading the first page. Anyone shed some laymen terms on where we are. On' off' on 'off' snow' rain' no shortwave' now a shortwave' disombobulatded
There will definitely be some weather next week..
-
9
-
1
-
1 minute ago, WINTRY WALES said:
Well that would be 7-14 days of milder weather..pretty long in my book
Not really, considering that’s the U.K. default. Most here would also say a 10 day cold spell isn’t long too…
-
2
-
-
2 minutes ago, Scott Ingham said:
I didn’t get the Scott Ingham day full stop I found it a little embarrassing as I’m just a weather enthusiast tbh Phil! But if a forecast comes off why would you not be enthusiastic about it when you’re learning. This place is a my d*** is bigger than yours atmosphere n i just care about the science only! I’ll get more wrong than right!!
Please keep going, if you stop then I’ve only got 4 people left posting on this thread as the others have all been blocked!


-
7
-
-
- Popular Post
- Popular Post
24 minutes ago, Taylorthesnowman said:As a complete novice it's somewhat frustrating to read certain models need to be binned because they don't show what people want to see.i love informative posts and this thread.but surely you don't just dismiss a model because it isn't what you want to see? Thankyou all for the information you are providing though.im slowly learning a few things.all be it very slowly.
As you clearly have identified, a vast number of folk hang on every model run and put emotion before scientific analytics. So you're less of a novice than you might perhaps think! You do have to sort the wheat from the chaff on this forum, particularly at this time of year otherwise it ends up reading like a thread from mumsnet.com.
We already know the background signals are very well placed, the building blocks if you like. The latest GFS run is just another solution and one which isn't supported by UKM or EC but certainly isn't a set in stone solution for the next week, and neither should it be binned as you rightly point out.
The road to an embedded cold period is long, very long in fact, and I'm fairly sure we will see a good period of cold weather over the next 6 weeks unlike we've seen for a good few years. It may not align quite as we expect, and maybe not perfectly or from the current evolution of the model output. Patience is key, but thats a commodity in short supply on this thread at the moment, and it shows sometimes
-
17
-
2
-
 2
2
-
27 minutes ago, winterof79 said:
Not a reply to this post.....
Can we make our minds up The Azores high is a semi permanent feature an Azores Low is not and i wish people would stop referring to the"Azores Low" it didn't emanate from there just passes by after filling a nad
I think we all know what’s meant by an Azores Low - makes enough sense to me
-
2
-
-
18 minutes ago, GSP said:
All fizzling out on this run, and no surprise whatsoever it’s setting itself back towards default mild.
With such changes in the charts and still so far out, still hopeful another evolution is being sought so quite what we will be looking at as the day progresses tomorrow?
I’m seeing day time air temps, in the south of the country down to below -10. You have a strange idea of ‘mild’
-
2
-
-
- Popular Post
- Popular Post
19 minutes ago, Alderc 2.0 said:It’s so exciting I can barely contain myself….

Beginners mistake, that’s a weather app not model output

-
22
-
2
-
1 hour ago, Scott Ingham said:
From an emotional and passion perspective yeah I agree and I’m a cold lover and love the rollercoaster just as much as you do!
But from a scientific perspective and this is a science at the end of the day I’d disagree as it’s harder to maintain a calm rational head and makes it confusing for newbies us who are trying to learn the science. Plus it’s plain wrong to assume every operational run is correct it’s better to start with means and ensembles and look for any change in direction in them.
All just my opinion of course! You have yours and I respect it.
I’d go one step further, it’s not an opinion it is absolutely correct
-
1
-
-
31 minutes ago, Anthony Burden said:
-10 hpa showing it’s hand over the UK that does not happen much in this country the met office has stated that severe weather looks a small bet,my version is that the more we see those -10hpa temperatures a loft the greater the chance.
Your posts are quite vague, can I suggest if you make claims related to certain charts or to the MetO statements, that post links to support your commentary - otherwise it just means nothing to those reading it
-
1
-
-
10 minutes ago, Met4Cast said:
For what it's worth the multi-ENS which comprises of multiple model ensembles seems rather solid for a proper cold spell from this northerly. I often find this to offer the best guidance at times of uncertainty.
How does it compare to the same graph from 3 days ago though?
-
Just now, feb1991blizzard said:
The striking thing here no one has mentioned, the longevity is shortening all the time, look how quick the block is collapsing on ensemble means compared to 3 days ago. it happens every time a GH is progged.
It’s a noticeable and unfortunate trend now. That said, it’s not unsurprising, the EC has sniffed something out over the last few runs - which it quite often does in these scenarios.
-
2
-
-
12 minutes ago, Lukesluckybunch said:
What's the general feeling then looking at the models..is this cold spell mid month very much on..or are these ecm runs on to something,surely we need cross model agreement sooner or later.
It’s 10 days away, you won’t get cross model agreement at that range.
-
1
-
-
3 minutes ago, Hatewarmth said:
Correct me if I’m wrong but is this evidence that the ECZm op was in fact an outlier
I would agree, I would take this op run for what it is. Definitely the test of a seasoned cold weather chaser, separating the men from the boys - let’s have some stronger nerves!

-
3 minutes ago, johnholmes said:
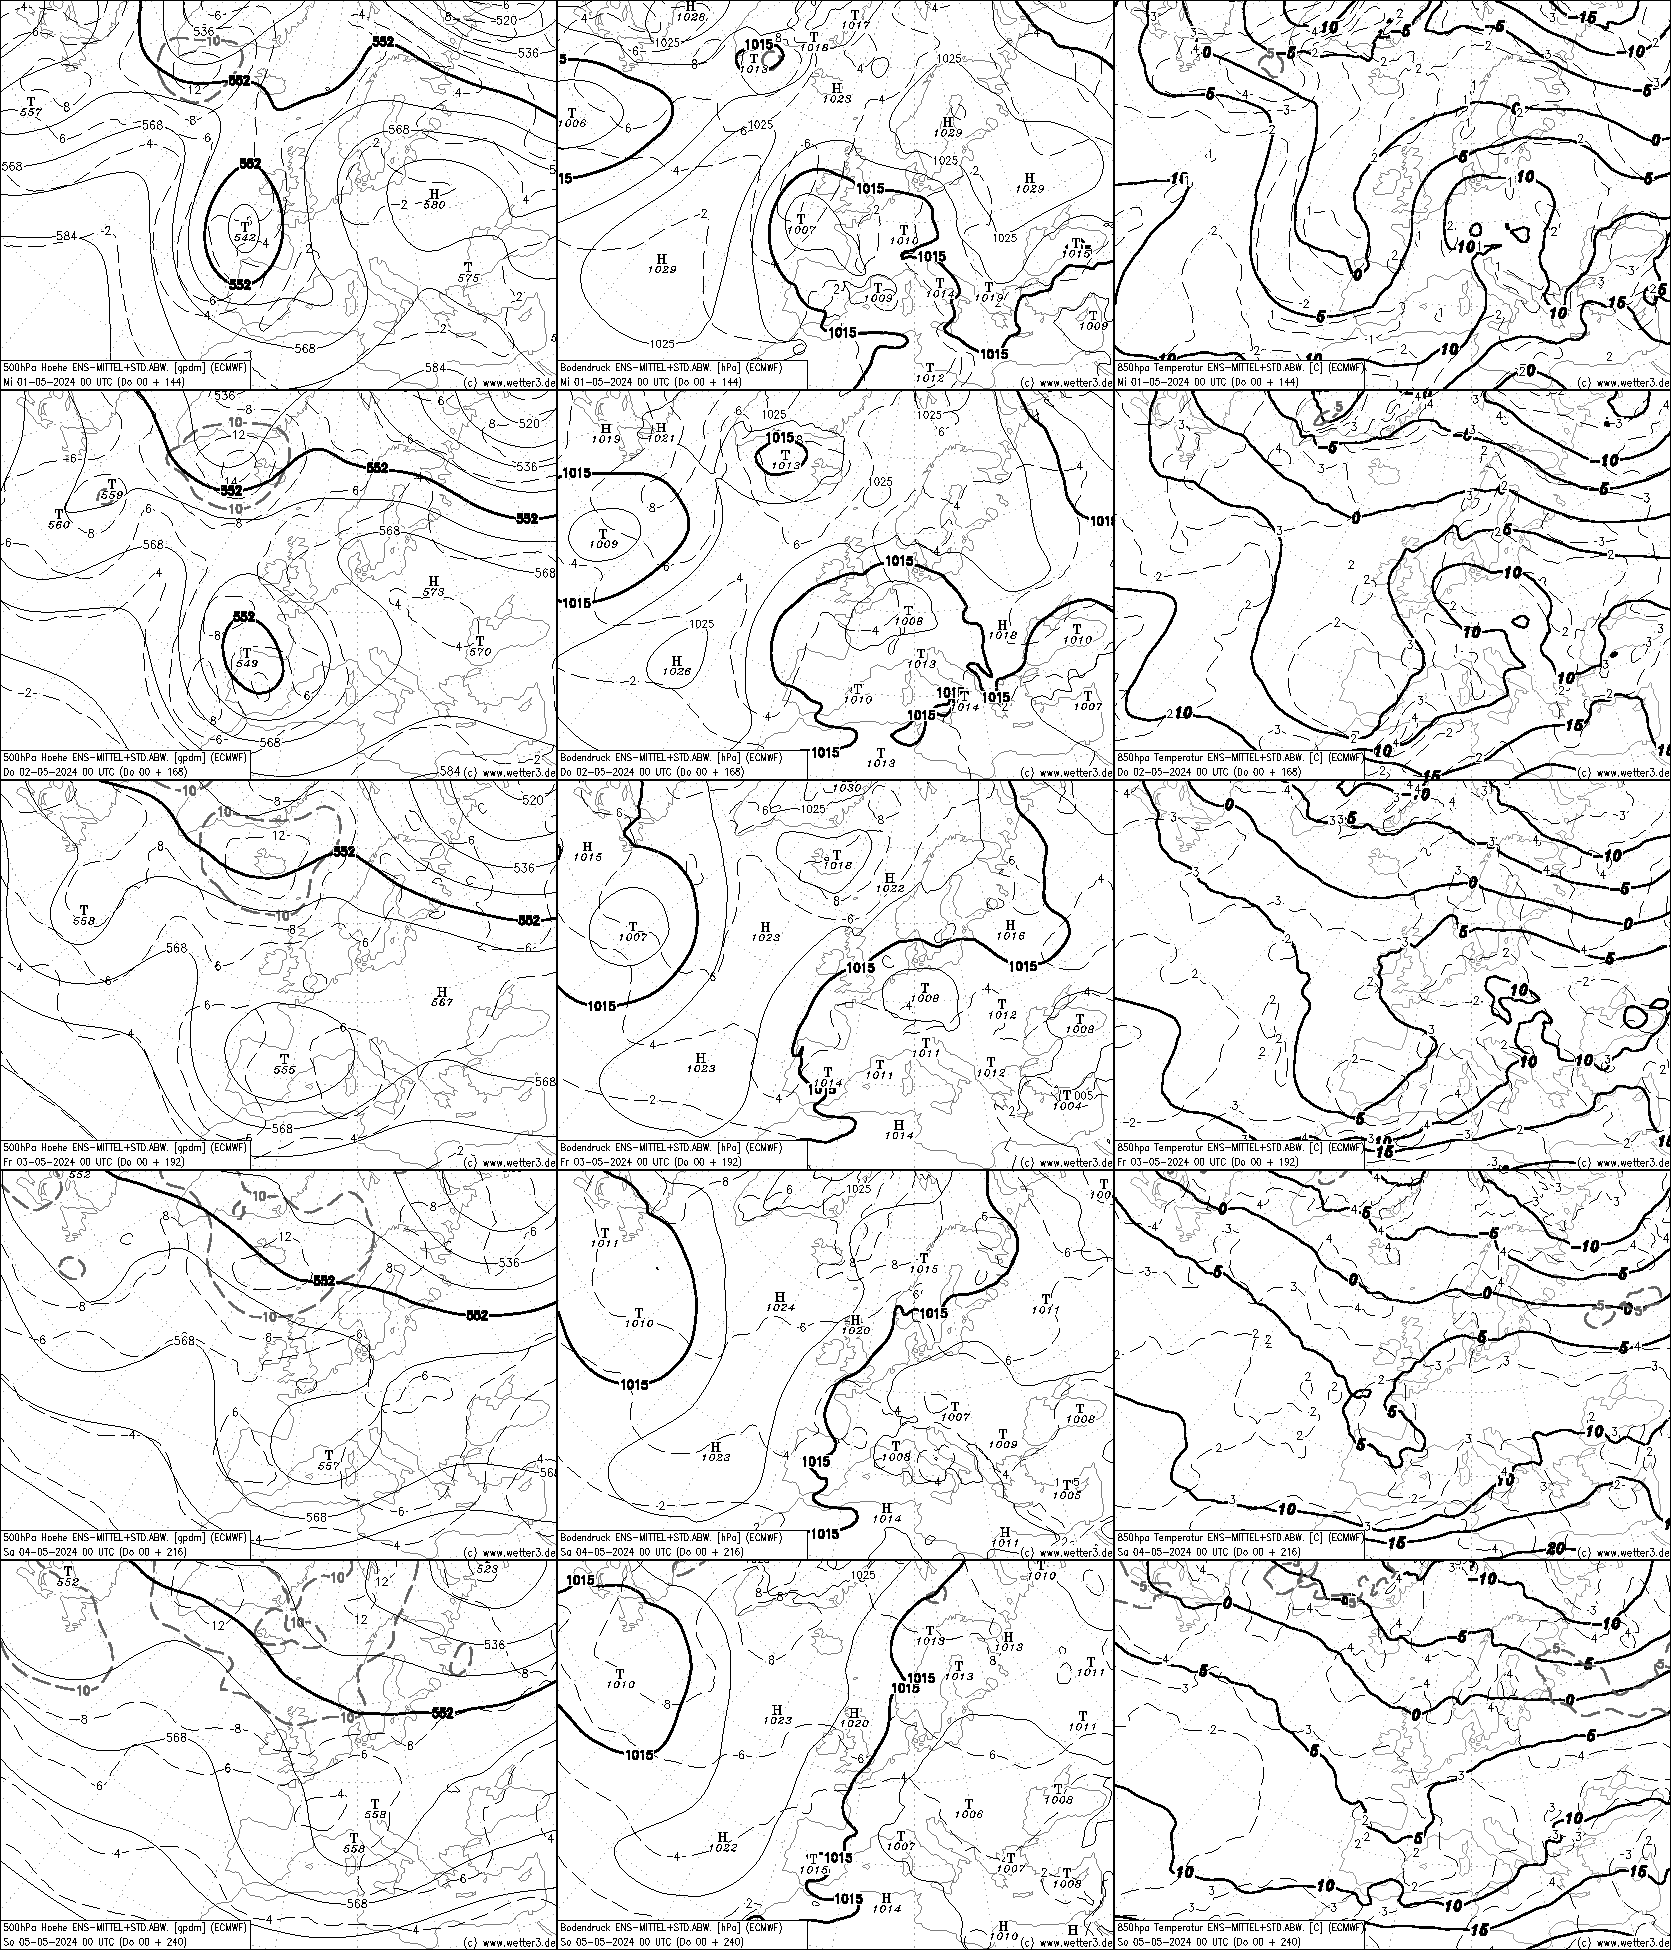
Friday 15 Jan update using the upper air charts (500 MB chiefly)
Taking ECMWF first and it has changed today from the last couple of days with both the upper and surface ridge shown as further NW than before. There is also in the last 2 days a signal for colder sir to advect west as the ridge conditions give way to a bit more cyclonic looking. 850 temperatures are brought down below -5 C in the last 2 charts. Is this a trend that will continue? Time will tell
The NOAA charts for 6-10 especially have shifted the C of G of the ridge first east and now again more west. In the more westerly position the European trough is obviously further west thus allowing the possibility of colder upper air moving west. Currently the version yesterday showed the actual contour centre in the NW of the UK with the very high +ve anomaly (+390 DM) being just SW of Iceland. The UK is currently not in any deep cold air on the 6-10 or the 8-14, although this hint at temperatures falling somewhat at 500 MB.
UK Met in the period 9-11 Jan ( their furthest public charts) show both the upper and surface ridge staying just north of northern Scotland. They have the European trough well east with a cut off upper low just south of the UK/nw France edging south over that period.
So with all 3 outputs in the 6-10 day period seem to suggest no deep cold air but with upper and surface ridging being somewhere over or WNW of northern/western Scotland. This suggests a mainly dry spell with frost becoming more widespread but depending on cloud cover for its intensity. The upper pattern to me suggests little probability further out of any break down in the block. Obviously its actual position is going to vary slightly but remaining north rather than south. Models predicting further ahead do seem to suggest that deep cold is possibly 14-20 days away from today? Not my scene so that comment may be incorrect but I’ll leave that to others to firm up on.
Climate Prediction Center - 6-10 Day 500mb Outlook
WWW.CPC.NCEP.NOAA.GOV
UK Met Office Fax Charts - UKMOMSLP Analysis and Prognosis
WWW.WEATHERCHARTS.ORG
UK Met Office . . Europe and North Atlantic MSLP analysis and prognosis chartsThank you John, a very measured and sensible piece of commentary nestled amongst the noise this morning
-
4
-
-
5 minutes ago, Snowy L said:
2023 has been a year of cold spells in winter or hot spells in summer disappearing at 5-7 days out. The models have simply cried wolf too many times. And I notice yet again this morning, after about 3 weeks of tracking this cold spell, that we are still saying how amazing the charts are 300 hours out. I won't believe anything until there is snow on the ground.
A cold spell is almost certain, I don’t think it’s foolish to expect that to happen now given where the models are at and that’s where the excitement is focussed. Snow isn’t a measure of a cold spell, and I can’t see anybody nailing their flag on that happening, it’s watching brief with low expectations I would suggest…at this stage.
-
4
-
-
18 minutes ago, Man With Beard said:
Regulars on here know I'm not prone to overstatement
 but this really is the most wintry T300 ECM mean chart I have ever seen. Incredible signal at that range. I had to check about 10 times to make sure it was the mean and not an outlier member!
And the mean is certainly the one to keep an eye on as we know. It’s been remarkably consistent
-
2
-
-
8 minutes ago, WinterOf47 said:
Bit of perspective at this stage…most of us will be lucky to see more than 5 cms. However, this kind of chart is not always good at picking up localised accumulations from streamers. If the latest run pans out, I would expect to see a few lucky places on the East coast and south east get over 10-30 cms of snow locally.
306hrs - pointless
-
2
-


Model Output Discussion - Spring Has Sprung
in Forecast Model Discussion
Posted
WYorksWeather we’re 3 weeks into Spring, it’s nearly April - when you say better/worse, upgrade/downgrade, that doesn’t really explain much to anybody reading your post and charts.