Temperature records falling across Europe this summer, a new UK high of 38.7C on July 25th as we see the warmest month, season or year announced time after time. Where will we be by 2070? UKCP
Summer 2019
This summer the UK recorded its highest ever temperature 38.7C (101.6F), beating the daily maximum record from the summer of 2003. Across Europe, temperature records fell in June and July as the northern hemisphere had its hottest summer on record.
Confirming records can take a few days, months or even years. The 38.7C record from Thursday 25th July at Cambridge Botanic Garden was confirmed a few days later by the UK Met Office. Initially, it was thought that just the UK July record would be broken, standing at 36.7C from Heathrow in 2015 but the plume of heat searing through Europe, with temperatures reaching over 40C, brought a heatwave up through the UK, breaking not only the July UK record but the all-time one set in August 16 years previously.
Summer 2019 Maximum temperatures:
England 25th July Cambridge 38.7C
Wales 25th July 32.5C Colwyn Bay
Scotland 25th July 31.6C Edinburgh and Floors Castle
Northern Ireland 22nd July 26.5C Killowen
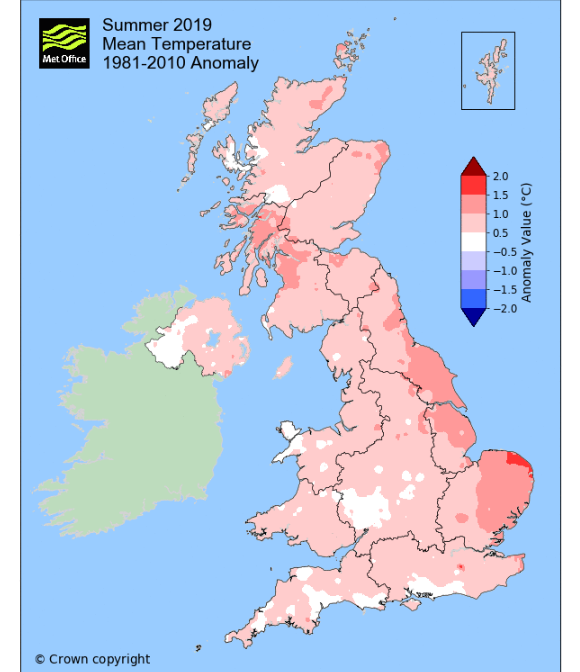
Summer 2019 was warmer (and wetter) than average in the UK
Some observation sites send data every hour, many are checked every 24 hours often at 09Z, so the following day and submit their data monthly. The summer 2003 record was 38.5C and it took nearly two months to come in. Not ideal in media circles. In the UK, records are subjected to quality control and analysis before verification hence the delay.
With a much longer delay, the WMO (World Meteorological Organisation) has just verified the highest temperature ever recorded for continental Asia. 53.9C in Kuwait and the third and fourth highest ever WMO officially recognised temperatures recorded, the Kuwait one and also Pakistan at 53.7C. These observations were from 2016 and 2017.
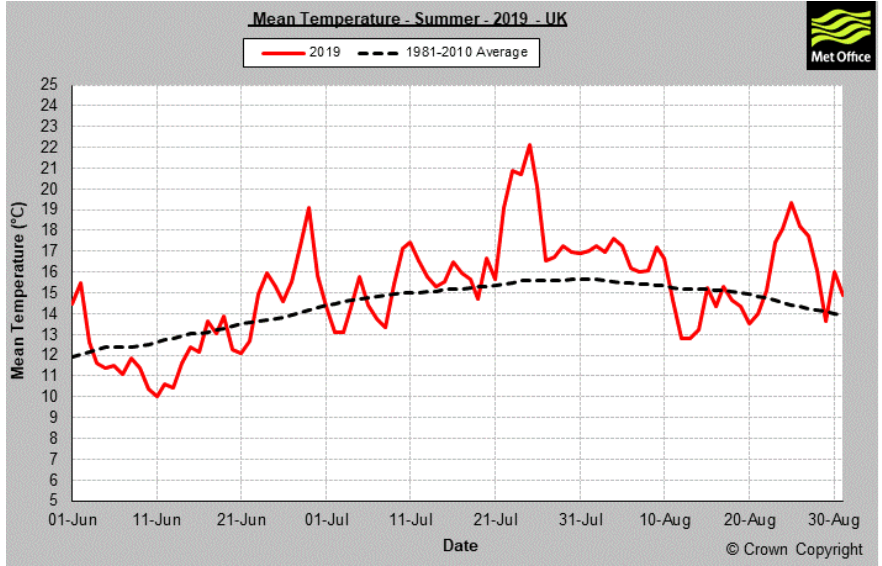
“The UK monthly mean temperature for June was 0.2 °C above average. July temperatures overall averaged out at 1.2 °C above average. August temperatures were 0.9 °C above average. This was the 12th warmest and 7th wettest summer in a series from 1910.” MO
In Sept 2019 the NOAA announced “Scorching temperatures around the world last month tied August 2019 as the second-hottest August on record and capped off the hottest Northern Hemisphere summer (June through August), tied with 2016. The heat also impacted Arctic sea ice coverage, shrinking it to the second smallest for the month on record.”
The seasons are divided into 3-month blocks for meteorological purposes, to help define statistics and climate data.
The highest temperature in Europe is 48.0 Greece 118.4°F back in July 1977. In 2019, France saw 46C at the end of June in the #Canicule heatwave. The old record also from 2003 was 44.1C, that's quite a change. Belgium and Netherlands broke records reaching over 40C, Germany plus 41C for the first time this summer. How long will it take the UK to pass the 40C mark?
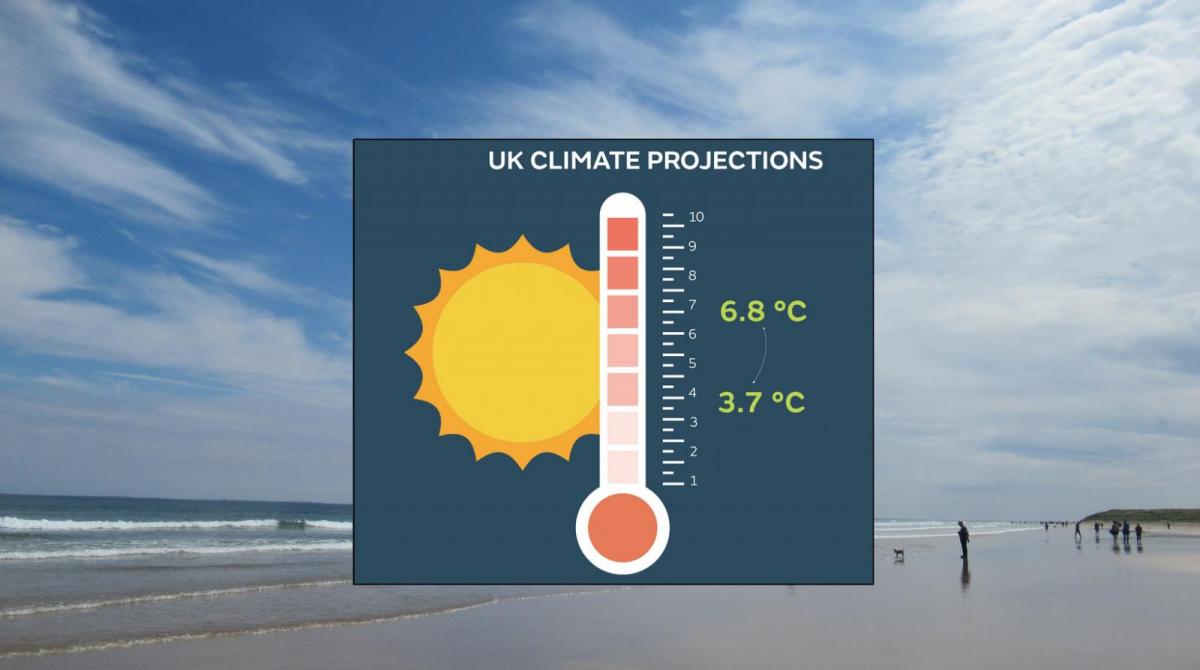
How the future could look.
As climate change affects the UK in the coming decades, more extreme weather is forecast including higher temperatures. Climate models have been running for the past year with projections released in Sept 2019 of how warm it could get, here in the UK.
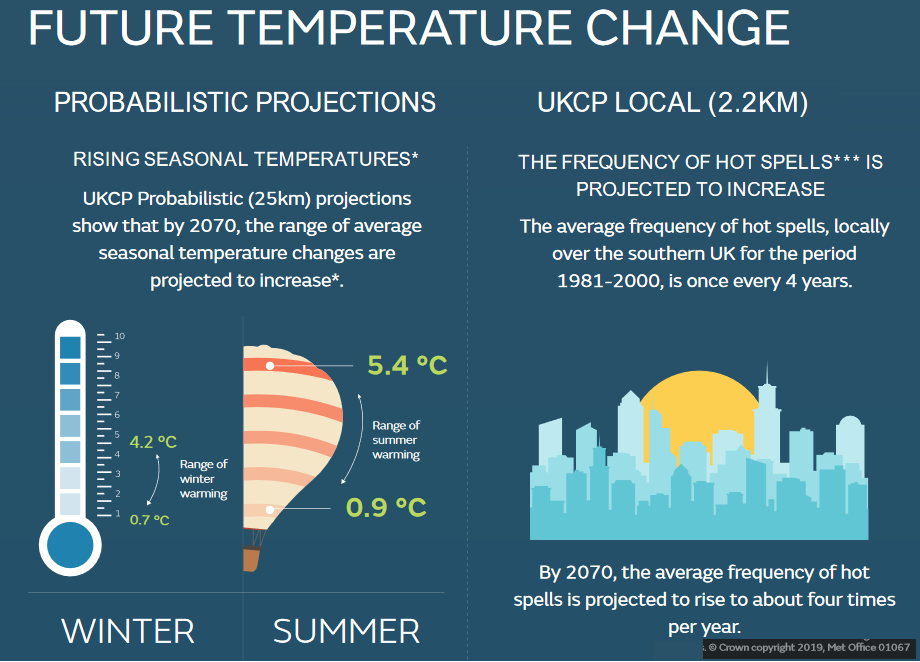
* Result are for the 10th-90th percentile range for the 2060-2079 period relative to 1981-2000 from UKCP Probabilistic (25km) projections. *** Hot spells, defined as maximum daytime temperatures exceeding 30 °C for two or more consecutive days
The new UKCP (UK Climate Projection) Local (2.2km) projections use a climate model at a spatial scale. This fine scale is usually used for our weather forecasting, and this is the first time a set of data has been produced like this. Part of the Hadley Centre within the Met Office, climate models would usually look at a 60-100km grid box. These projections build and add in detail to last years’ wider output: Warmer, wetter winters for the UK and hotter, drier summers. These were broadscale patterns of climate change. The key messages haven’t changed but the new model has allowed more specific detail at local level. Heavy, thundery downpours can be captured, localised showers which weren’t defined in the larger resolution. This can then help to predict how flash flooding events may increase. For temperature predictions longer-term, orography and sea breezes can now be included but also the urban environment, all that heat from traffic, people and buildings.
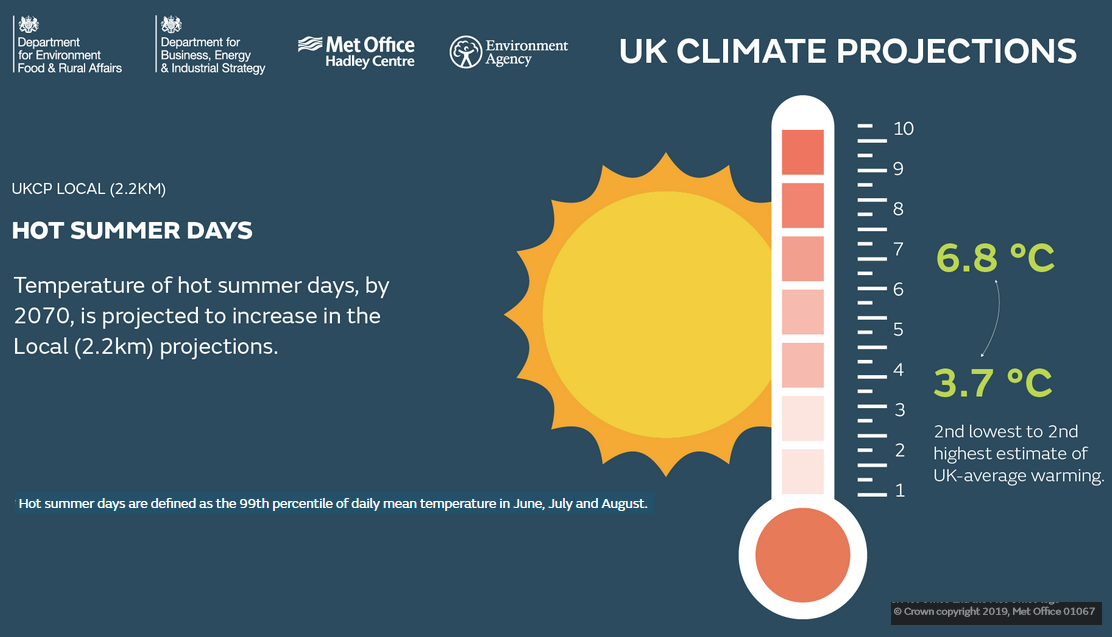
The output gives ranges of uncertainty but still with a guide of what could be expected within different time frames. The examples are for 2060-2080, others are available. Higher summer temperatures along with more hot spells and heatwaves. The research and data can then be used for public health strategy, infrastructure and climate resilience in town planning and flood prevention.
The language used for our summer heat and high temperatures is already beginning to shift, in some circles.
Whilst we might enjoy a bit of sunshine, warmth and fair weather rather than say a week’s holiday in wind and rain, these almost incessant temperature record or warmest timeframe announcements at national and international level have to be highlighted and treated with concern then action.
“July 2019 was the hottest month on record, with heatwaves and other extreme weather, even without a strong El Niño event,” said Maxx Dilley, Director of WMO Climate Adaptation and Prediction Branch. “The signal from human-induced climate change has now become more powerful than that from a major natural force of nature,” he said.
All-time records- According to the Weather and Climate Extremes archive, the hottest temperature ever recorded was in Furnace Creek, Death Valley, California at 56.7°C on 10 July 1913. The highest temperature for the Eastern hemisphere was set in July 1931 in Kebili, Tunisia, at 55.0°C. Some weather historians have questioned the accuracy of old temperature records.