UK Heatwave of summer 2018, why does your car temp not count, the thermometer in your sunny garden. And what's that about an ice cream van and Scotland's non record-breaking temperature?
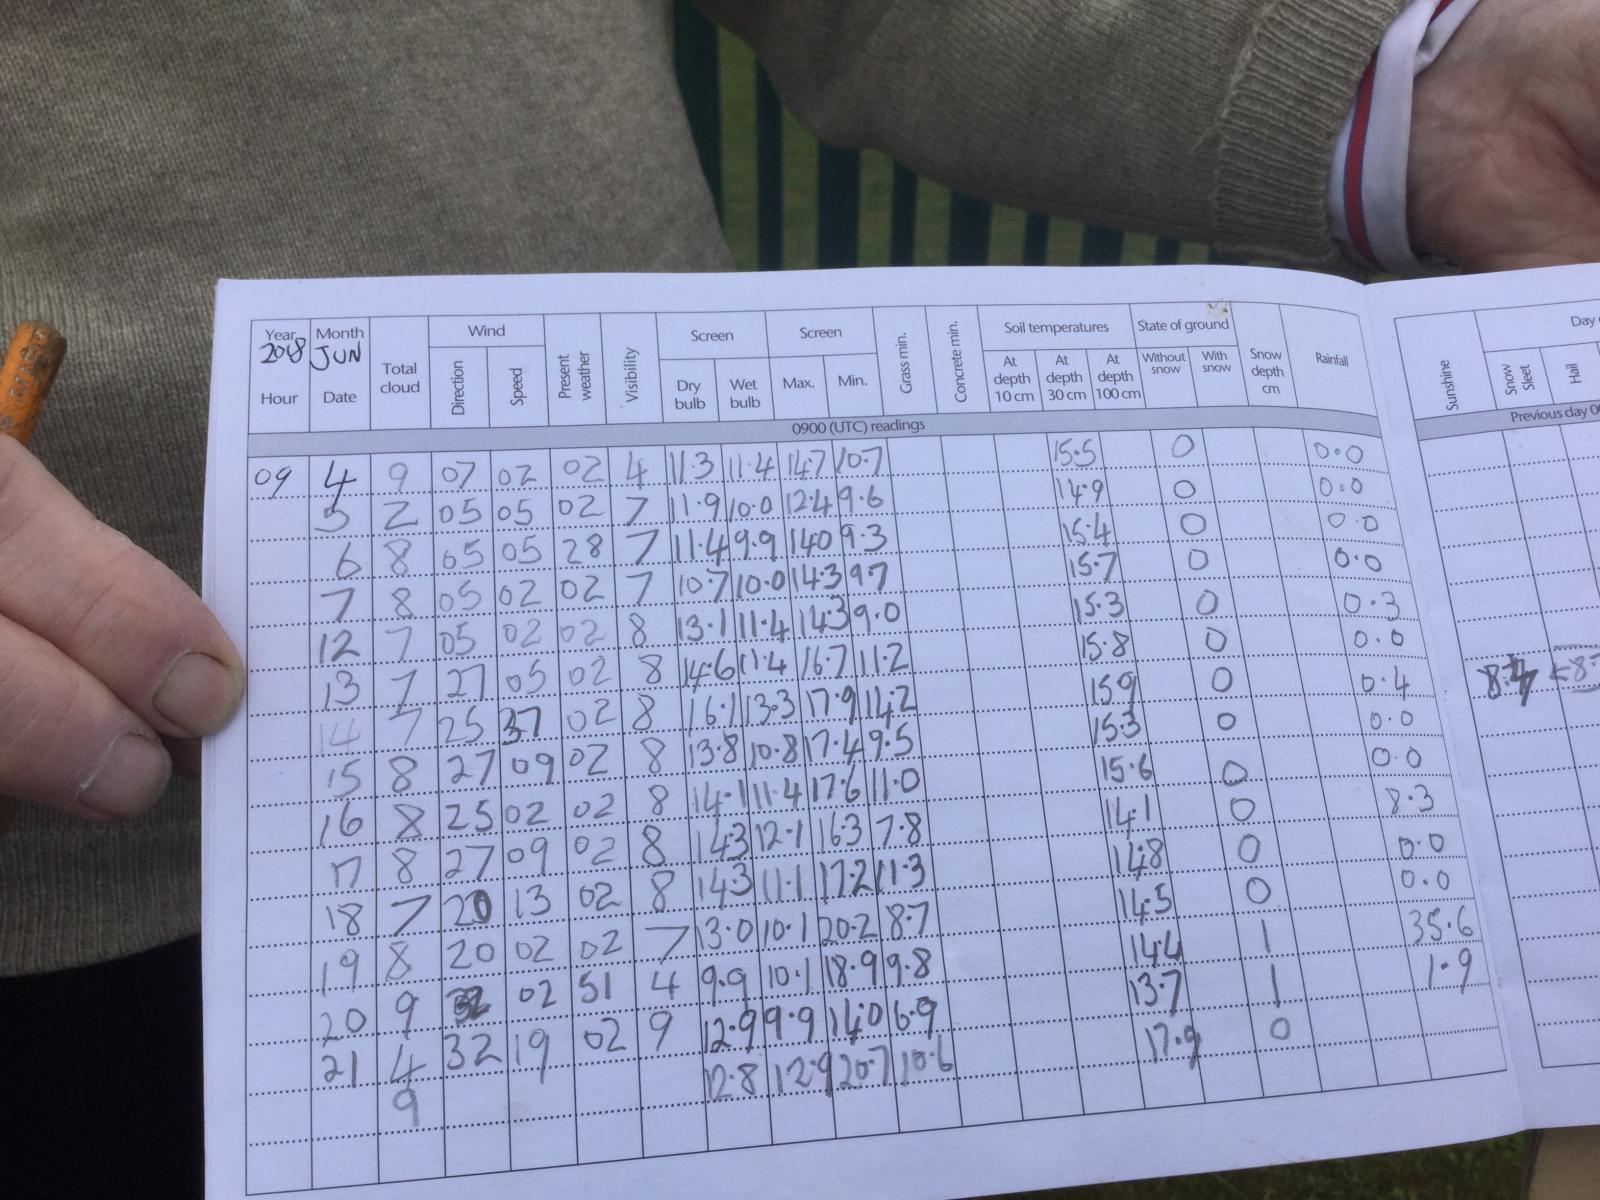
Who takes the weather observations? The Met Office has a network of observers, volunteers who note temperature, wind speed, sunshine and rainfall at least once a day. Some observations are taken every hour, others every three or six. All this data is shared online with observations around the world, from ships, buoys, the other UK observers, military sites and airports. The hourly data gets input into weather models as initial data, the daily data recorded as climate records to show how our world is changing. One particular daily observation is called the NCM, the National Climatological Message. People go out every single day at 0900 GMT rain, shine or snow to retrieve the figures. It includes a max and min temp for the site, rainfall and sunshine totals for 24 hours.
You may have your own garden thermometer, a weather station even but for the data to count the site or weather enclosure has to meet certain criteria. The recording equipment is the Met Office's own instrumentation which is carefully calibrated to national standards.
We often say that car thermometers or those on a sunny, sheltered garden wall don't count, they over-read in stagnant air, metal enclosure or direct sunlight to give a false reading. Air temperature is recording in the shade, at a certain height above the ground and should be in a site that is exposed not sheltered.
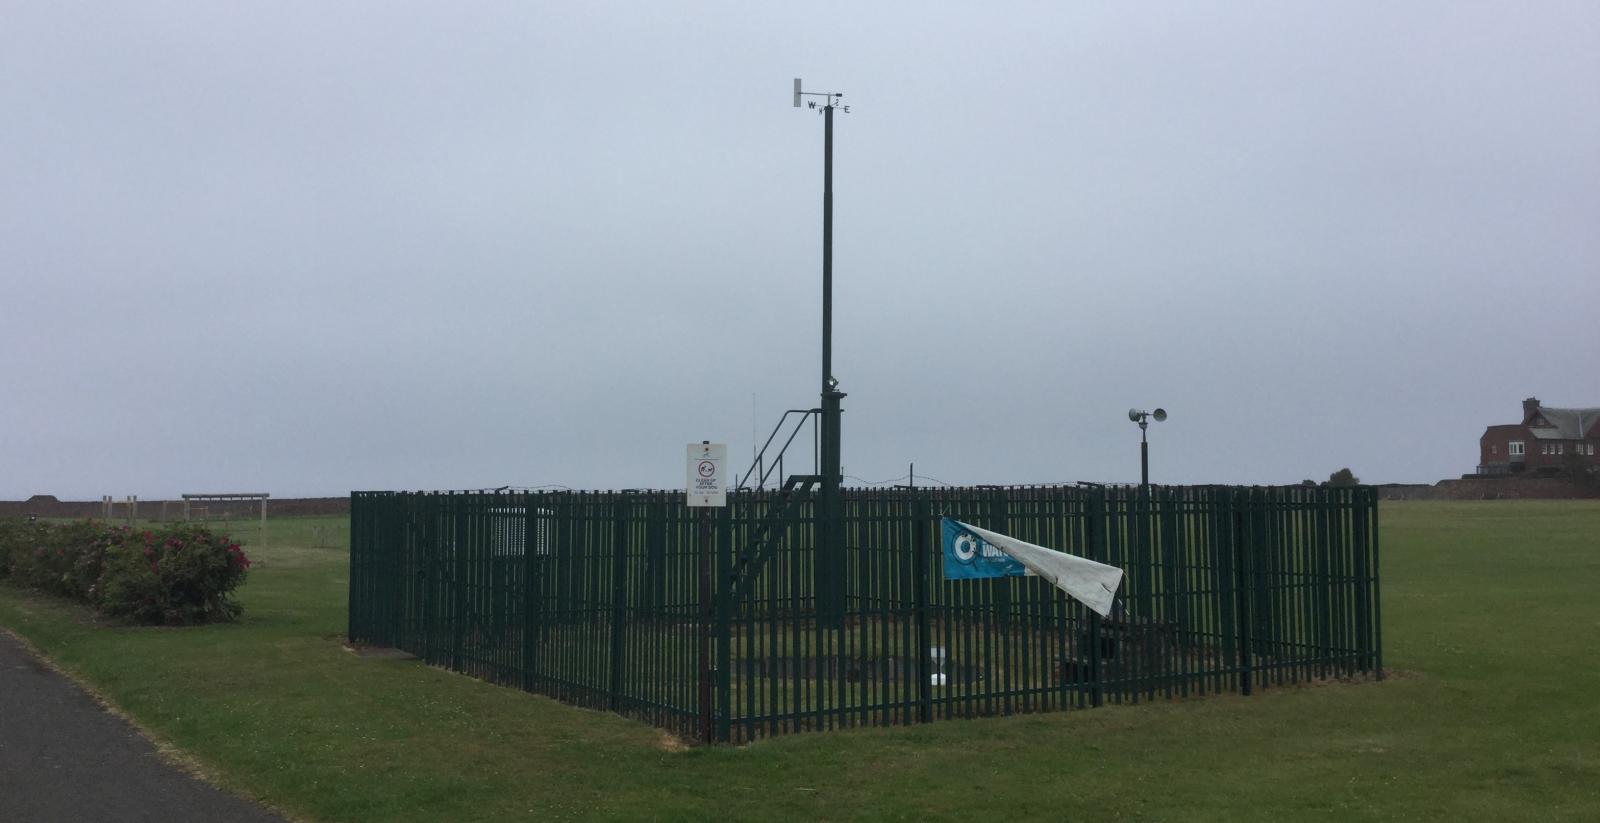
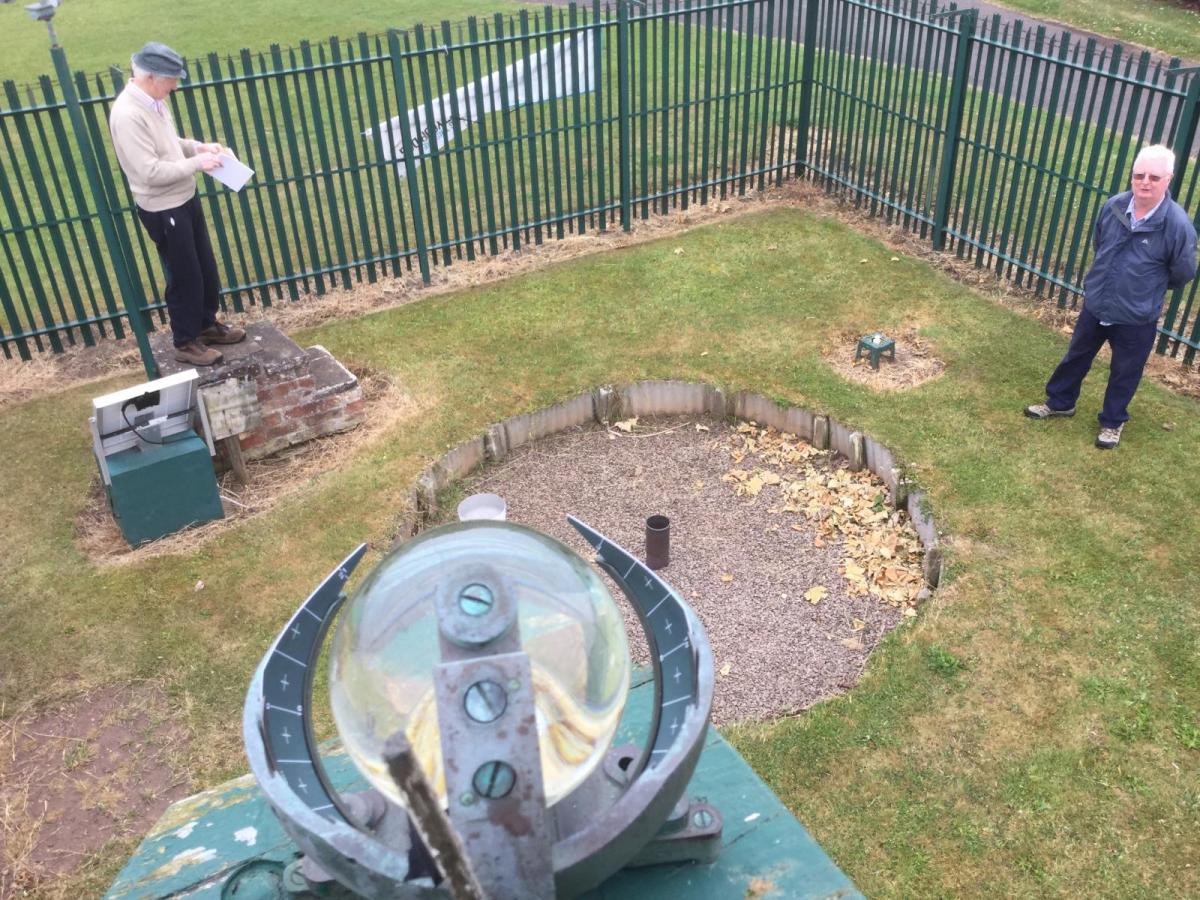
I headed to Winterfield weather enclosure in East Lothian to meet the volunteer observers and see how they go about their daily task.
As we are in BST, it was 10 am rather than 9 am for the readings to be taken. This was NCM time with a more general observation of cloud, visibility, current air temp. and wind.
The site had been looked after by two local men for many years who retired in their 90s and 80s. The steps up to the sunshine recorder had become too much, also reading the small grading on the thermometers. So, new boys, Kenneth and Ronnie have stepped up, or just did a weeks cover and got left with the notebook for six and two years so far now. Anyway, they showed me the ropes. A couple of decades ago, just before I started my forecaster training at Shinfield Park in Reading, we did two weeks observer training. On the course, those who had already been observers gave out sage advice about how on earth you could tell heights of clouds by eye and fill in visibility distance or what to write on a nighttime ob. for cloud cover. Plenty of details began to come back to me.
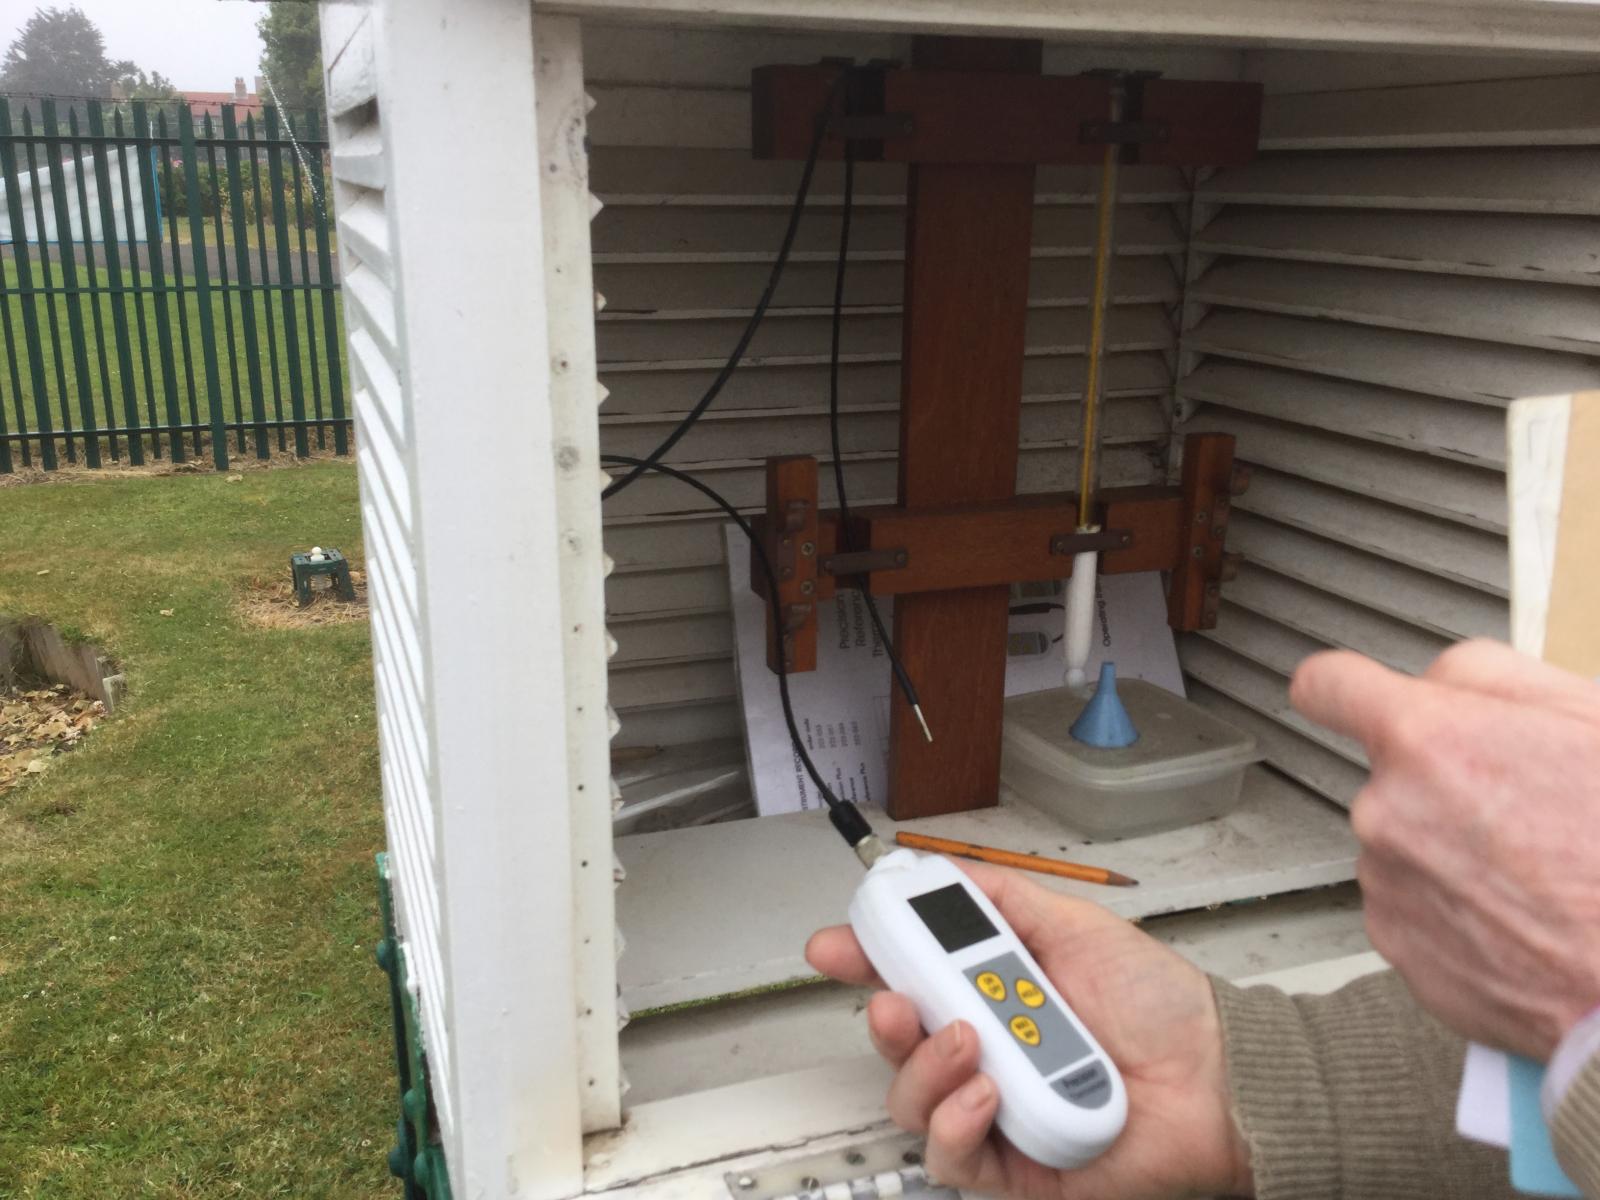
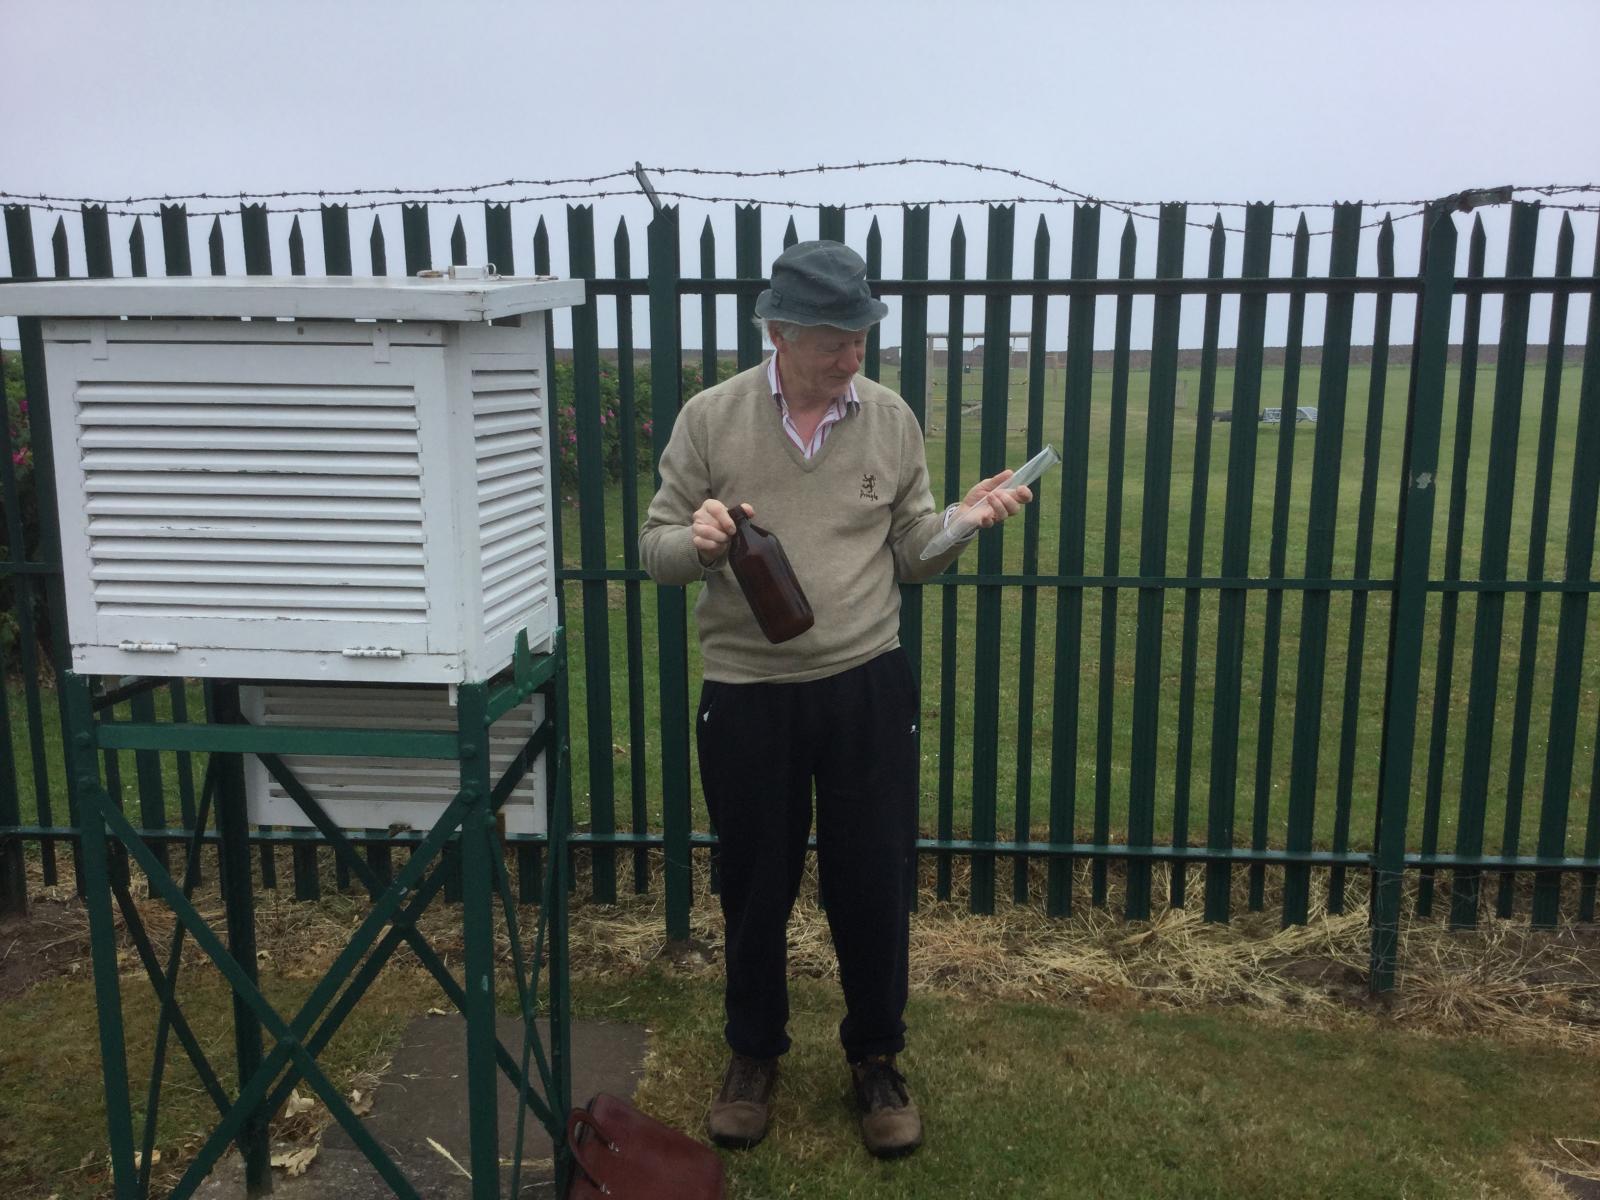
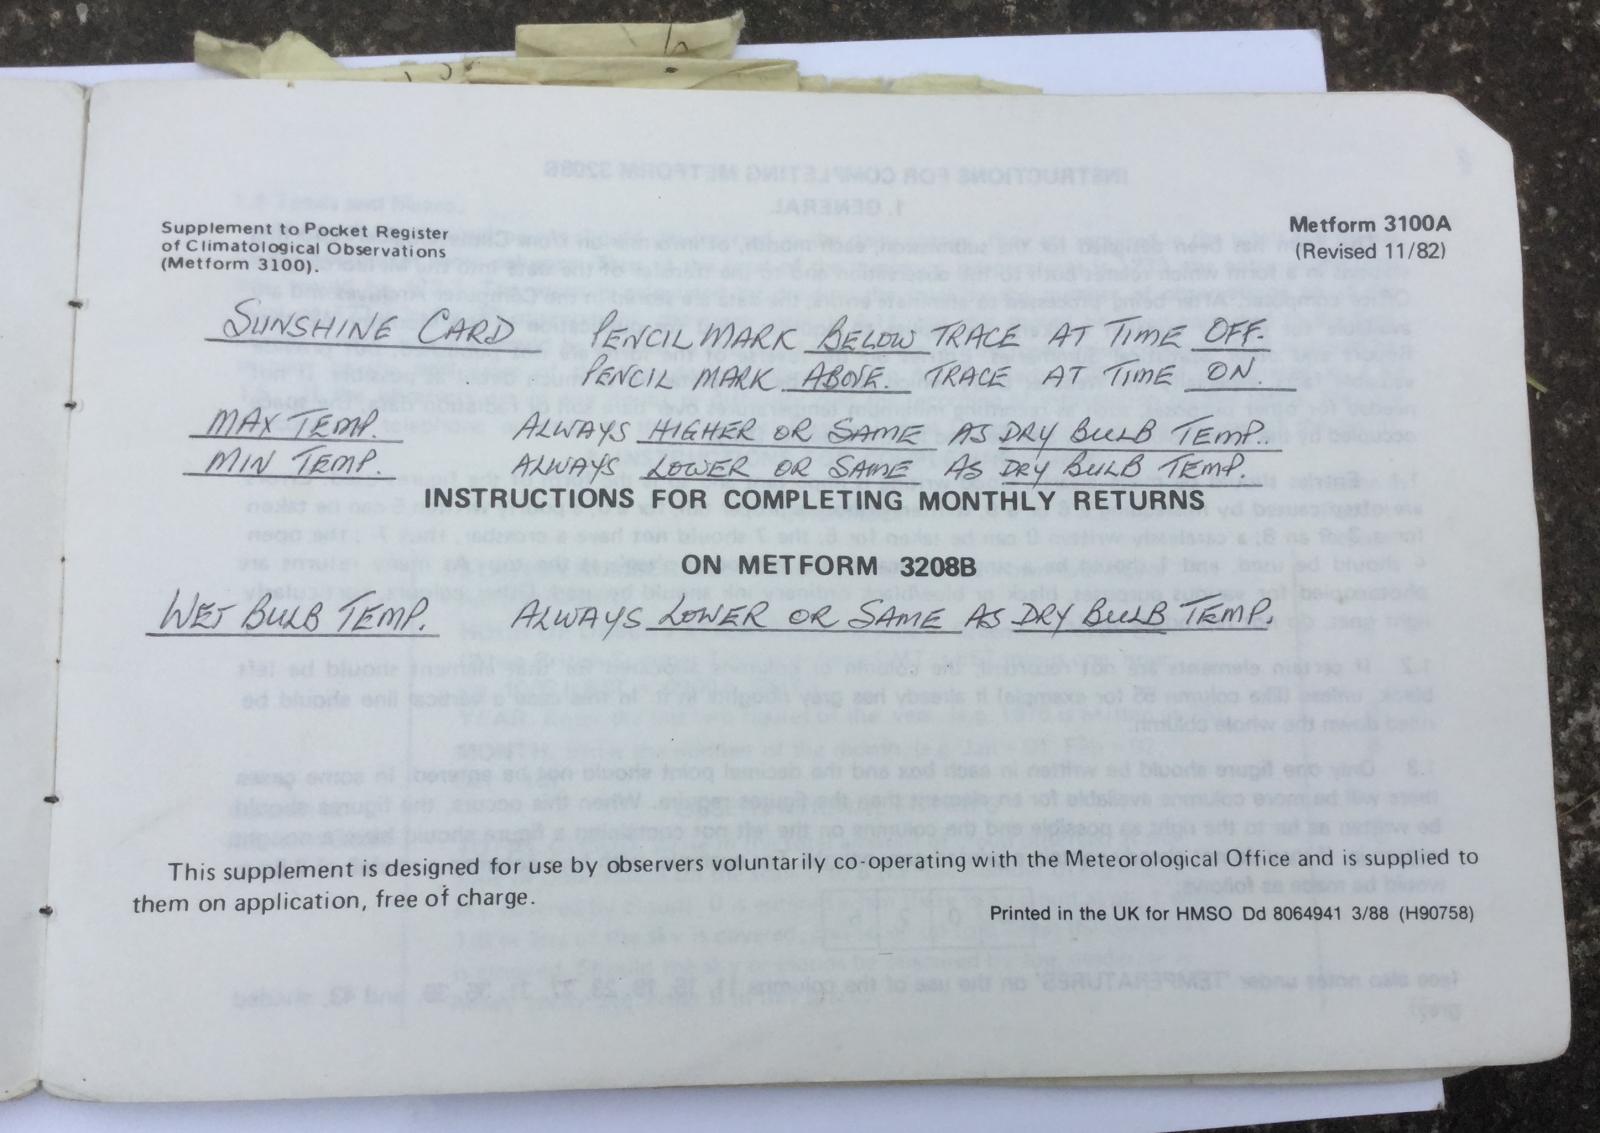
You may have seen the Stevenson screens, the white louvred box on four legs. These are set at a certain height with the door opening northwards to avoid direct sunlight. The temperature has to be read as soon as possible. The slats allow the air to flow through the shaded box and the white paint reflects the solar radiation. The slats should be kept clean and clear and the white paint bright. Inside is a max-min thermometer and a wet bulb thermometer. The digital probe gives the current temp, maximum for the period and minimum. Usually, the highest air temperature is in the afternoon, the min around dawn. Not always though if a front goes through.
The wet bulb thermometer has a little cloth sock which is kept damp. One duty is to make sure the distilled water reserve is topped up. The difference between the air temp and the wet bulb temp is called the wet bulb depression and gives information about the humidity of the air. It is then used to calculate a dew point temperature and can be used in fog forecasting or for air mass indications.
The surface should ideally be grass. Surface temperatures can vary wildly so the thermometer in a Stevenson screen should be 125cms above the surface and the base of the screen 110cm above surface, to avoid some of this and to compare fairly to other sites. Being on a tarmac surface, like Heathrow runway, or sheltered by shrubbery is not ideal. Having a parked ice-cream van next to the site is far from ideal but we'll come back to that *.
It is the temperature of the air in the shade.
There was also a depth temperature, 30cms below the surface. A thermometer stays underground on a chain in a steel tube. These deep soil thermometer bulbs used to be coated in beeswax to slow the thermometers reaction when it is taken out each day. This thermometer was retrieved from its hole and read quickly. The Observers eye needs to be straight on to the top of the mercury, not at an angle up or down to avoid parallax errors. For all readings, it has to be quick so that the direct sunlight doesn't alter the reading, or change of air or just the observer's body heat on a cold day.
Rainfall
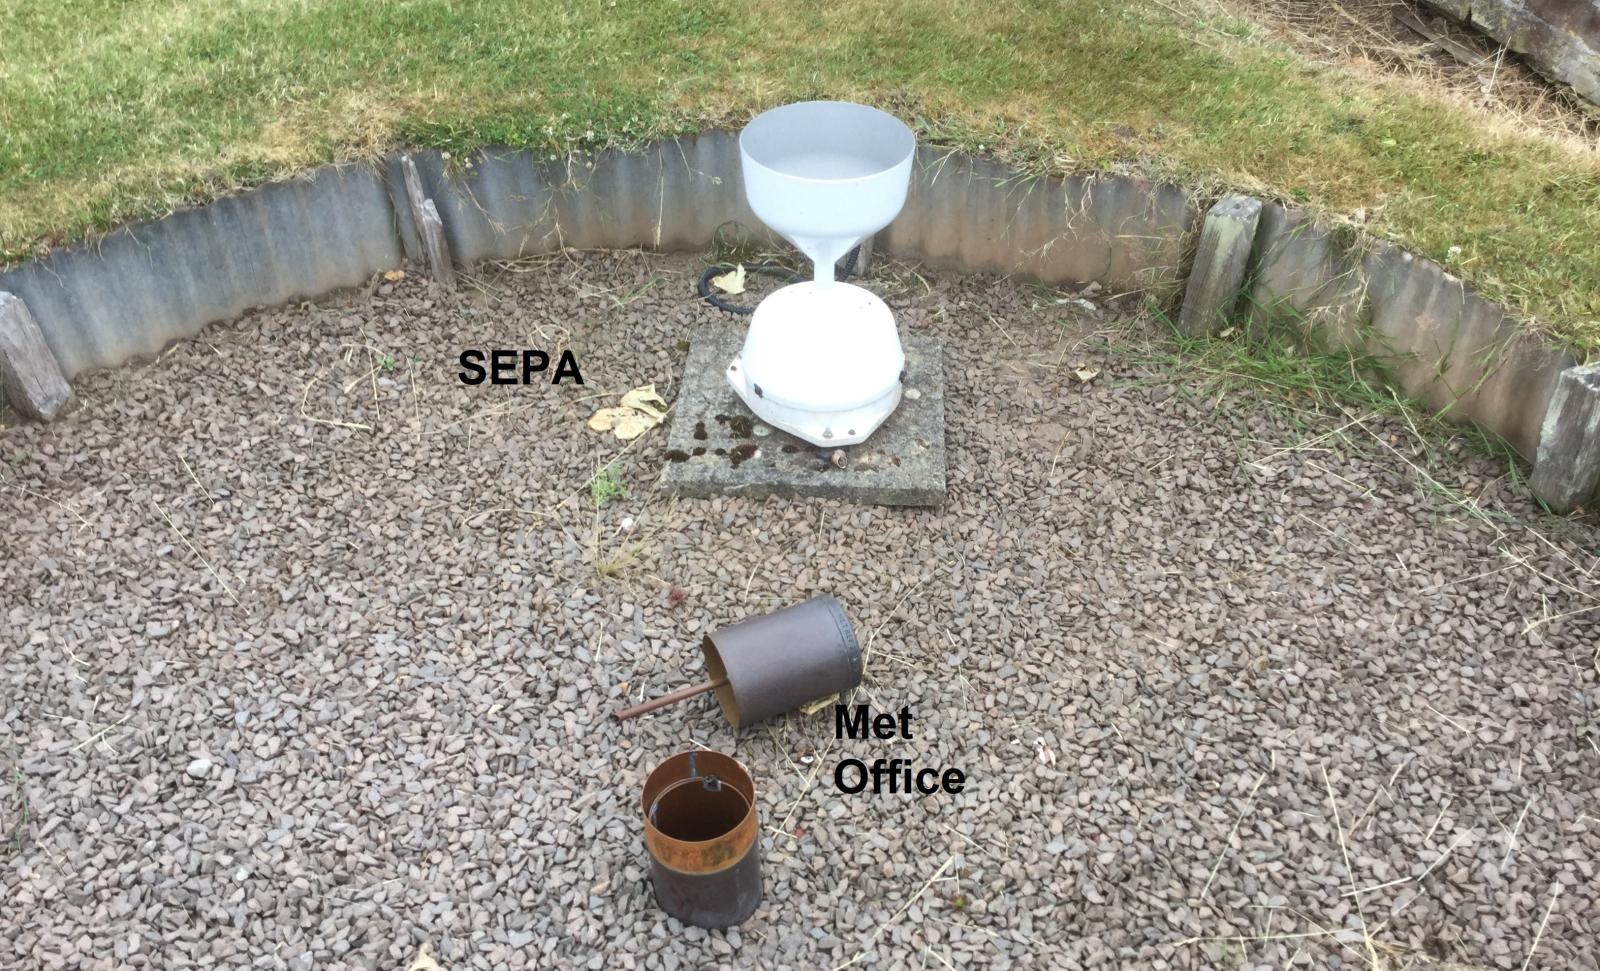
There were two rain gauges within the enclosure. The larger white one was from SEPA the Scottish Environment Protection Agency and the other dark metal one was the Met Office's. Taking off the top part revealed a brown bottle and any water would then be poured into a measuring tube. There wasn’t any that day. If there is a tiny amount which doesn’t even reach 0.5mm, then Trace is recorded. Tenths of a millimetre are recorded up to 1mm and then in full millimetres with any rounding to the odd.
The site needs to be exposed enough without overhanging trees or buildings but still have some shelter from the wind. There should not be any splashing into or out fo the gauge or evaporation. The wind can interfere with rain getting into the gauge and the white SEPA one had a more modern design to help combat air-flow reduction. Maintenance of the gauge would include keeping the funnel clear of grass cuttings, soil, sand and leaves and also making sure that the glass bottle was intact.
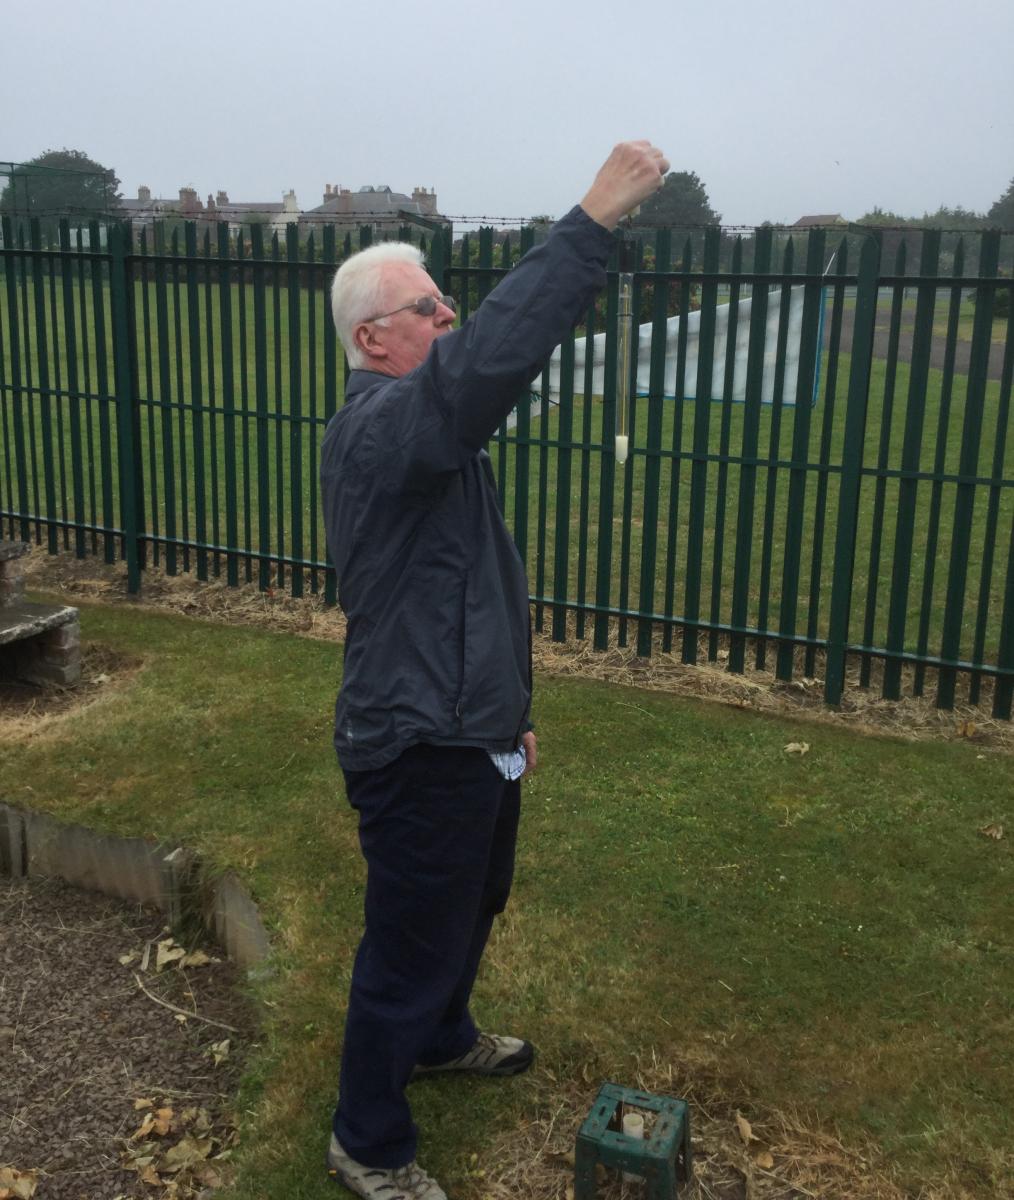
The empty bottle is replaced and next is sunshine. My favourite part of the equipment. The sunshine recorder with its glass sphere. The glass focuses the sunlight onto a special piece of card and burns it. The time is manually calculated by adding up the sections on the day's graduated card. There had been clear blue skies and sunshine, so there was a continuous score for many hours.
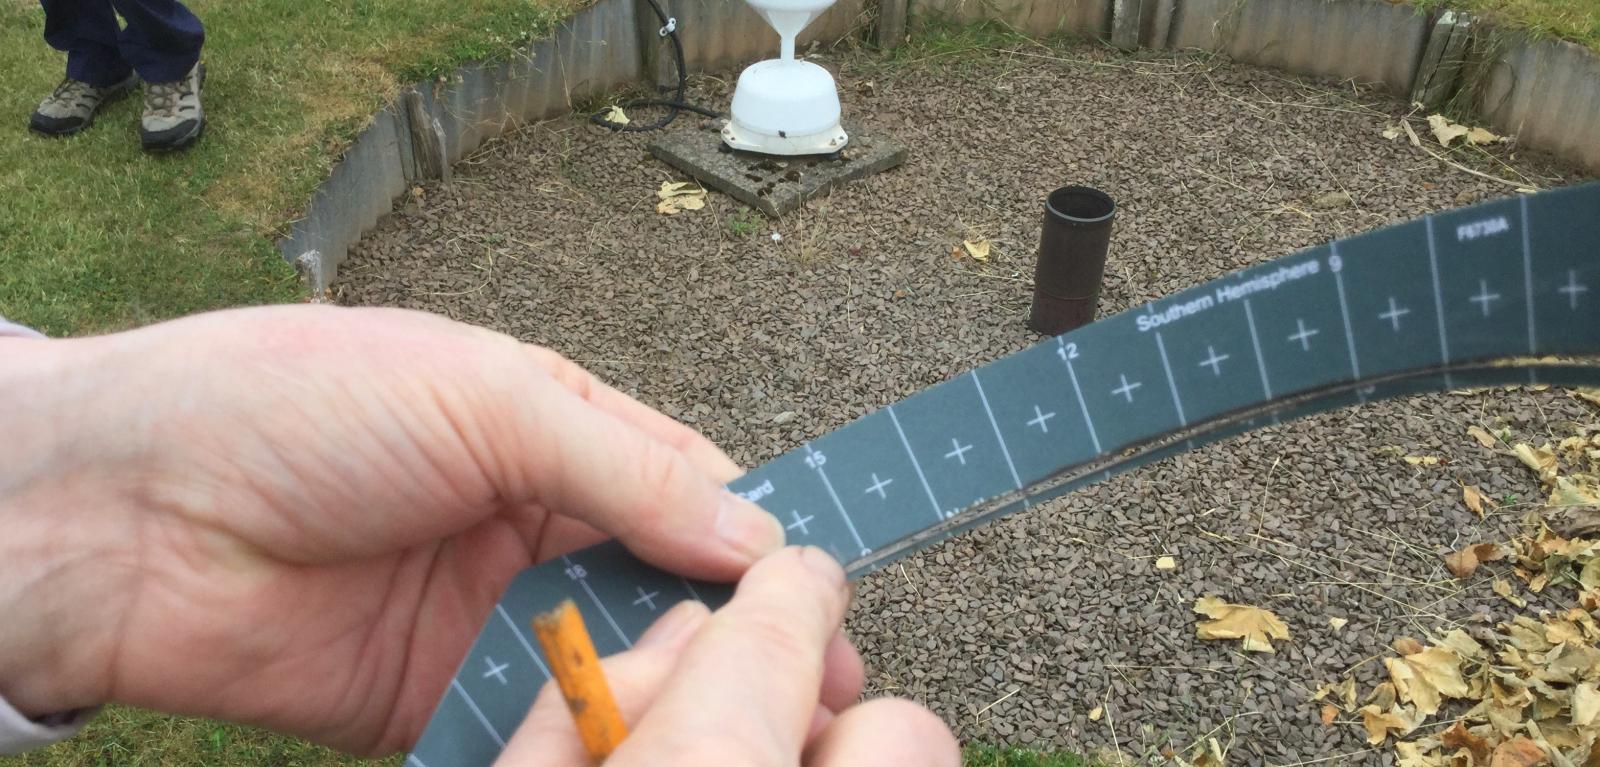
The reading is per day, so when changing the daily card, the observer has to mark in pencil 10 am. Any burn marks before this mark will need to go on the next day's figures. So in summer, you could have a scorch mark on a card from day one before the pencil mark and this time needs to be added onto the after pencil mark burns from day 2. Added together these two portions give the total sunshine for a day and this can be up to 17 hours in summer.
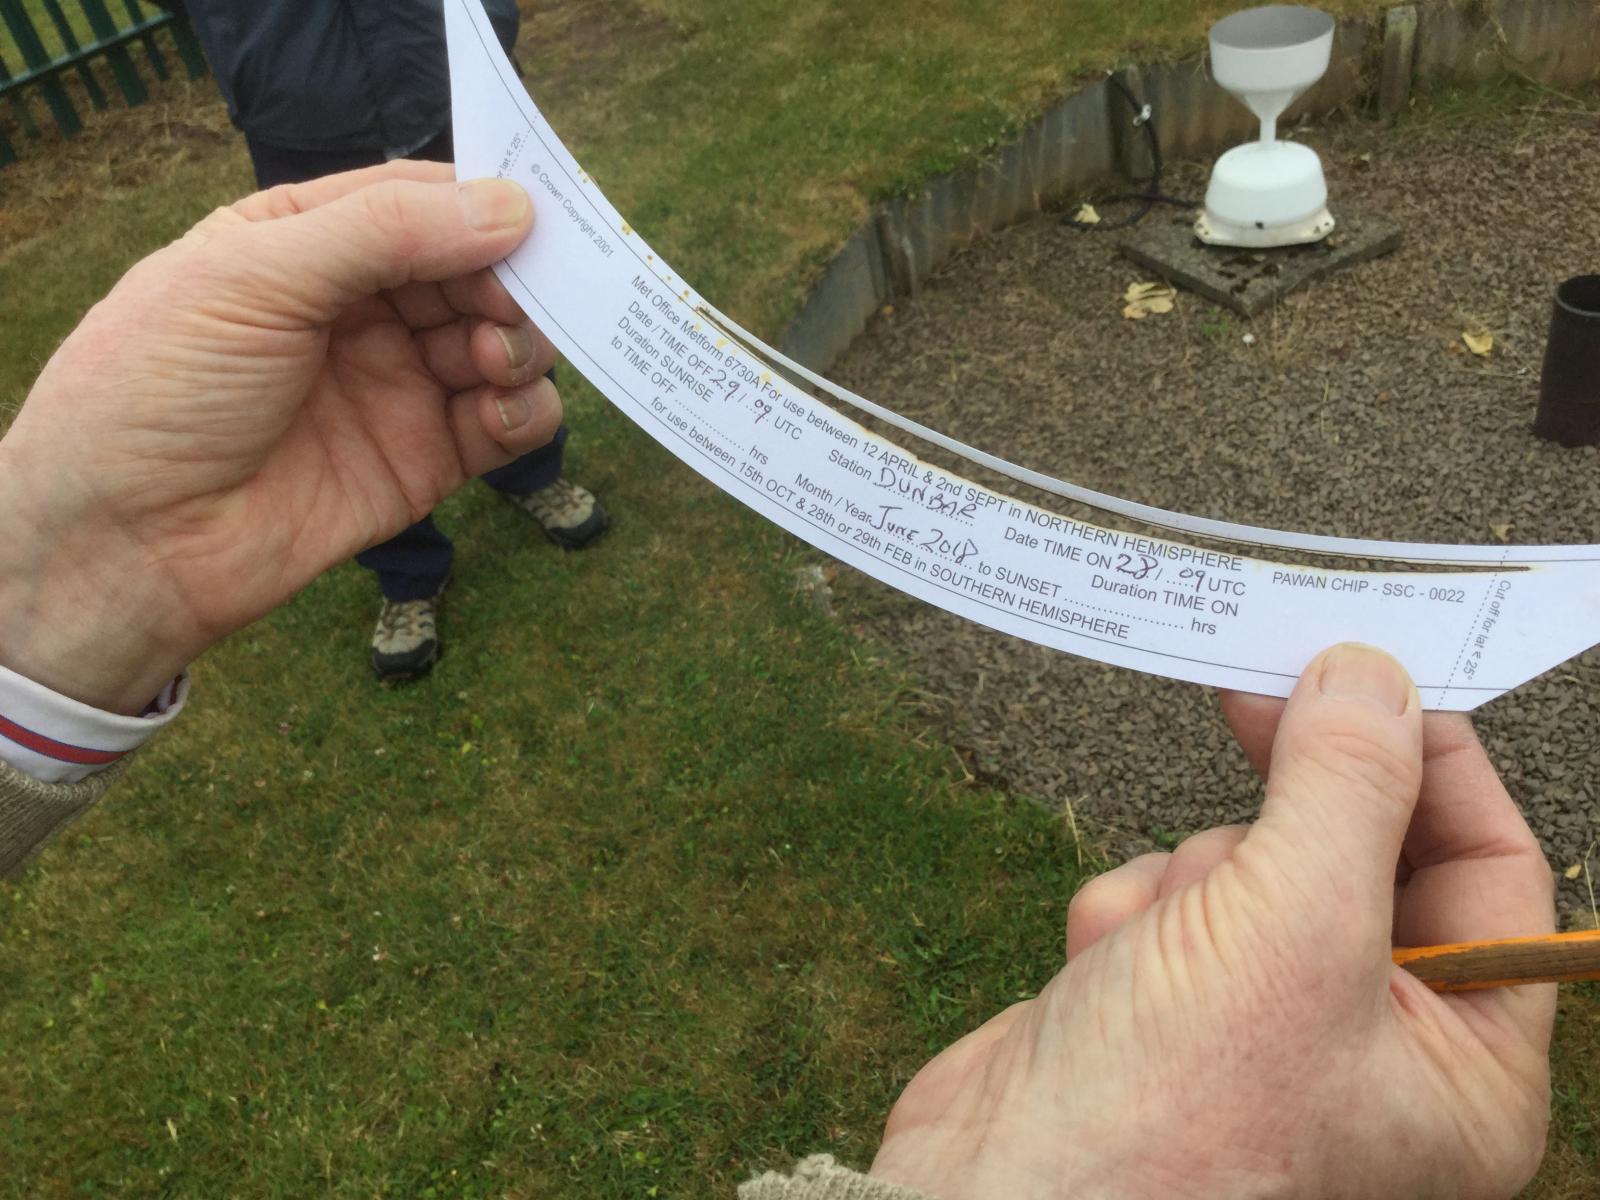
Details are filled in on the back of the card, and a new one slotted into the metal holder which curves around part of the sphere. Mayfield Park in Southampton had a problem with people nicking the glass ball, thinking it would do for fortune telling. It doesn't, it is scientific equipment.
Next was the wind direction and speed. There was an anemometer, but I think the Beaufort scale was used. The very tall wind vane hadn’t worked in a while even with the fault being reported. So it was back to the old throw dry grass in the air trick to find the direction, as the winds at the surface were so light. The direction recorded is where the wind is coming from.
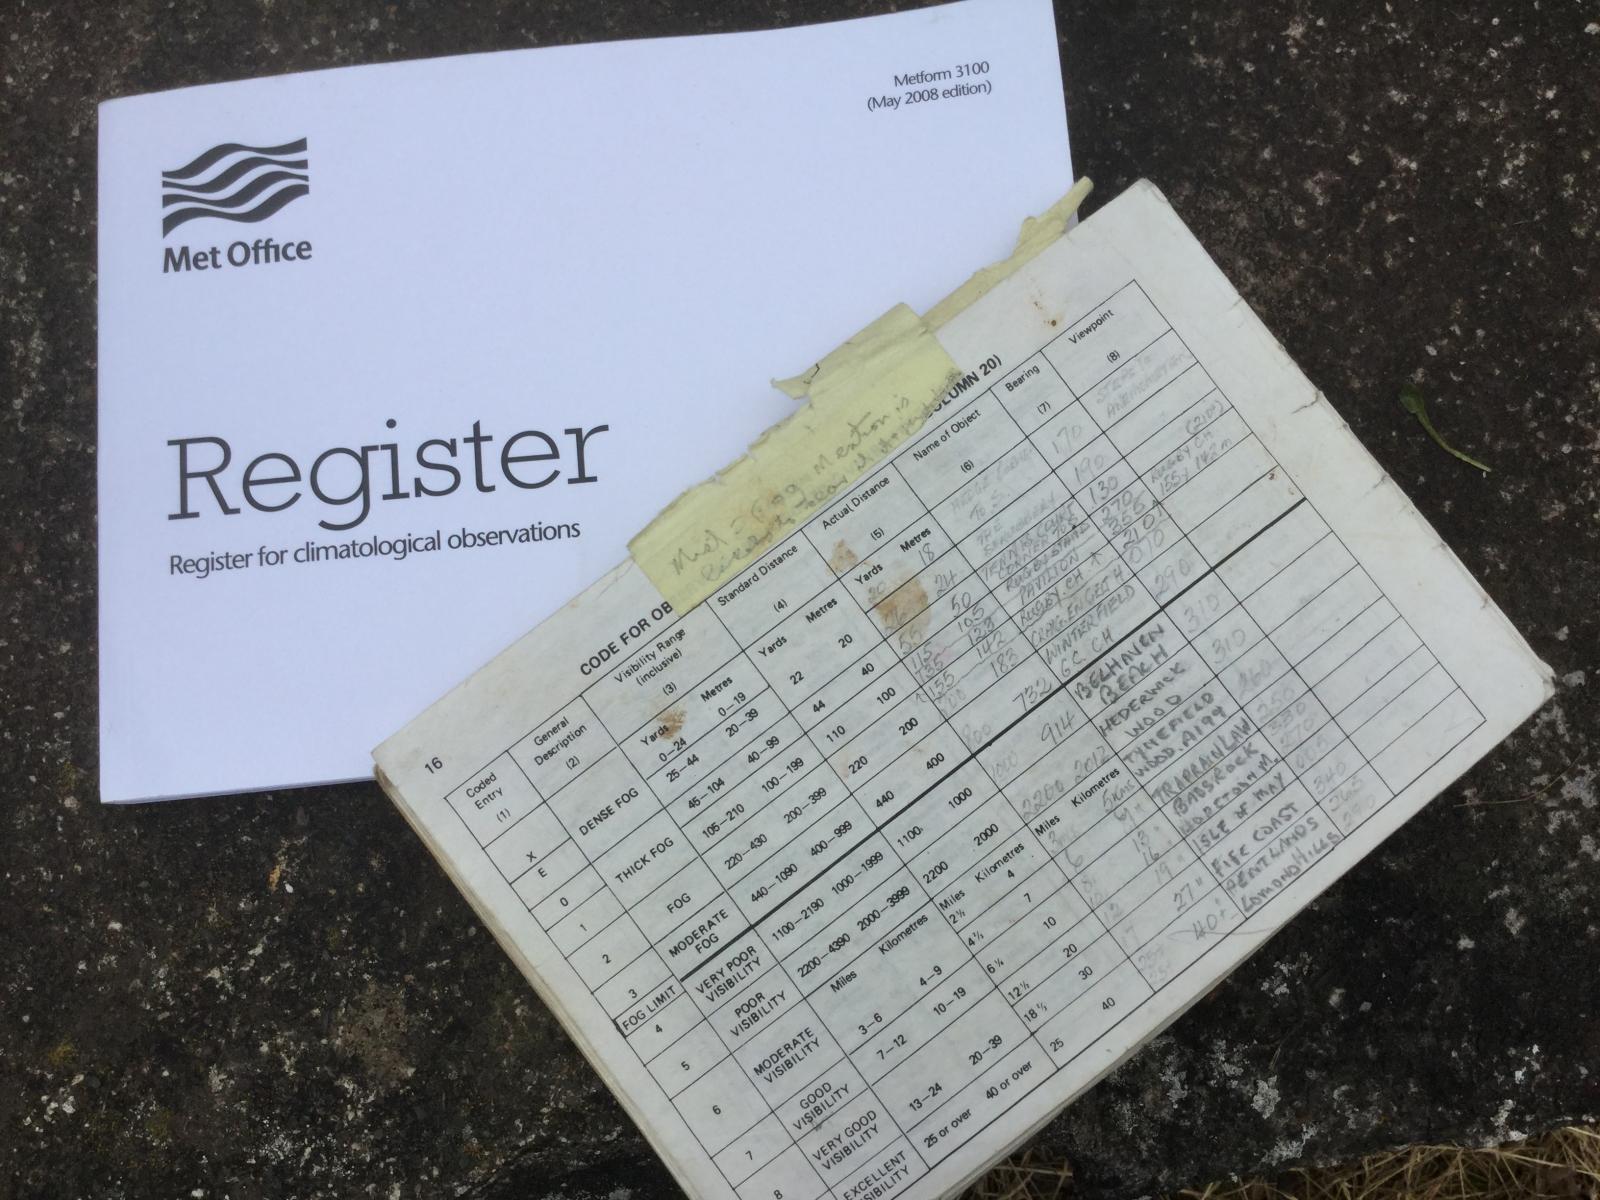
Visibility
Judging how far you can see is tricky unless you know the distances of objects and landmarks. There was a detailed old list in the pamphlet for observers of Winterfield; a golf flag, Islands in the Forth, Fife across the water, the Pentland Hills near Edinburgh. On the official hourly ob, the distances would have been in metres up to 5000 with the lowest <100m. Then 5km to 30km in 1 km steps and then 30 to 70km in 5km steps with top visibility being >89km. This is horizontal visibility and you would always round down a distance if the next step hadn't quite been reached, to err on the side of caution. So 44km still gets recorded as 40km.
When Observations don't count.
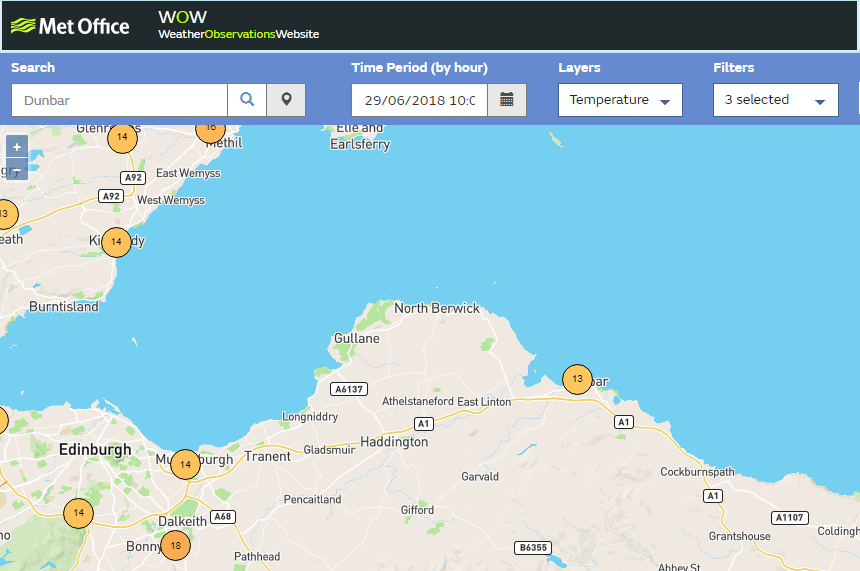
The official data is uploaded into the UK forecast model as starting conditions, and these official observations are available to meteorological organisations around the world. The data is also uploaded in the UK to WOW (Met Office Weather Observations Website), which contains a rather mixed collection of figures. When the NCM data is collected, current air temperatures will be uploaded in the 09-10 section with a current temperature. Other (non-official) people can upload their data too, so just be aware of what you are looking at. Look at the drop down list. Back at the end of June, Bishopton near Glasgow had a hot day with 31.9C being reached, this shows up later in the afternoon from hourly observation record.
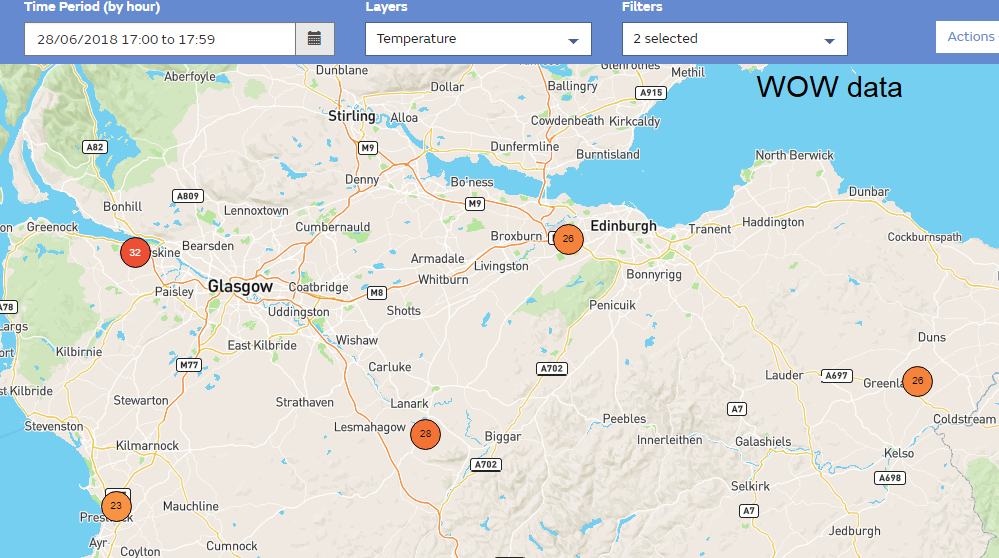
* On the same day, a temperature observation appeared from Strathclyde Country Park near Motherwell of 33.2C, a fair bit higher than the others. All of the NCM data is collated by the UK Met Office at the end of the month as they issue their monthly summary, seasonal data and update any record values. The temperature record for Scotland in June was 32.2C and all-time record 32.9C so this would have a been a record breaker.
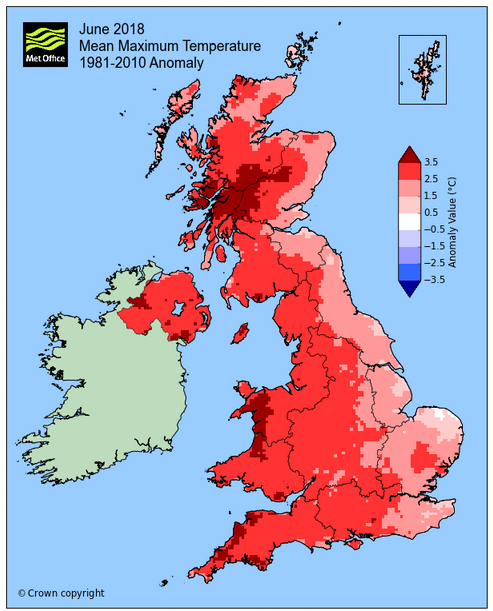
It was announced with the caveat that it had not been checked and was still provisional at the end of July 2nd. A few days later after some investigation, the temperature was not included. It appeared that a "vehicle" parking nearby could have been responsible for a spike in the temperature reading. An often present ice cream van seems to be the culprit but the overall clutter, tarmac and general chaos calls into question the site as a whole. See below centre right in photo.
Back in 2003, it took several months for the Brogdale, Faversham, Kent temperature of 38.5C to be ingested and accepted as the UK's highest ever temperature on record. In early July 2015, Heathrow beat the UK July record at 36.7C amid outcry at the searing heat coming off the nearby runway tarmac or aircraft.
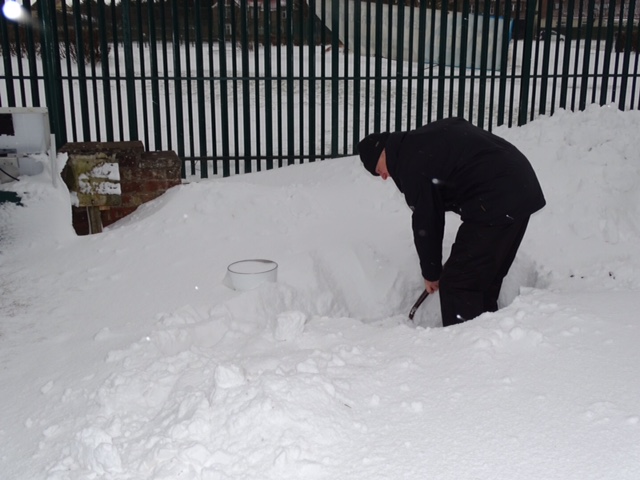
Present weather and cloud types can also be recorded. And also snow depths. The Beast from the East caused havoc in SE Scotland as the dry snow blew in off the North Sea and gathered in the lanes and roads which run north-south through the counties. This snow filled in the hedge-lined ways with several feet gathering, collecting and then staying for weeks. Coastal site Winterfield, by a golf course, got a good covering with the observers having to dig out the gauges and deep thermometer after first measuring the snow depths of course.
If you are interested in becoming a voluntary climate Observer for the Met Office to contribute daily climatological readings which become part of the permanent archive and form an important part of the climatological record for the UK. They do ask volunteers to commit to a minimum of five to ten years as the length of record is vital to providing a good UK climate set. More details.
If you just want to chat and discuss various weather observations in your local area or region, the Netweather forum maybe the place for you, with the online community have several weather threads as well as a lot of discussion about weather around the world and the various forecast models.