In recent years there's been a lot of discussion about weather patterns getting stuck more frequently. Is the weather actually changing, or is it media hype? And, if it really is changing, do we have any clues as to why?
The UK is renowned for its mixed weather. Plenty of rainy days, brief warm spells and the odd cold, snowy period in winter. When weather patterns linger for weeks or months, they can often lead to memorable or even destructive events. Think of the summer of ’76 or the winter of ’62-63. In recent years there’s been a lot of discussion about weather patterns getting “stuck” more frequently. For example, we experienced the wettest February on record followed by an incredibly dry Spring in 2020. The chief executive of the Royal Meteorological Society, Prof. Liz Bentley, commented that:
“It’s unprecedented to see such a swing from one extreme to the other in such a short space of time. That’s what concerns me. We don’t see these things normally happening with our seasons.”
This, of course, raises several questions. Is the weather actually changing, or is it media hype? And, if it really is changing, do we have any clues as to why?
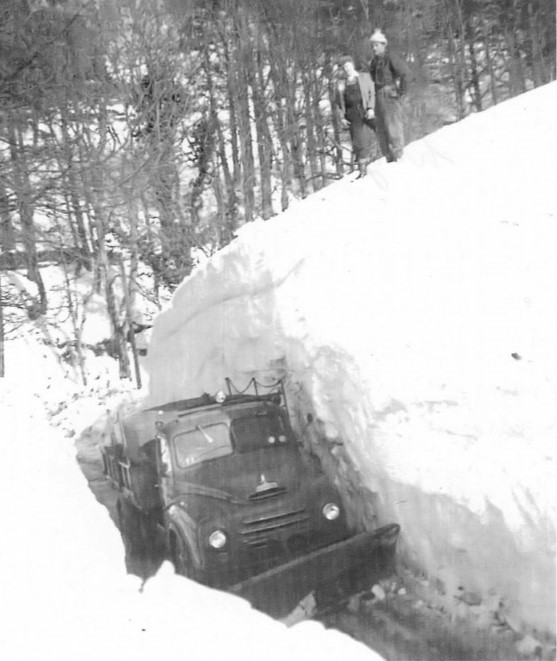 [Extreme snowdrifts in Northumberland during the winter of ’62-63]
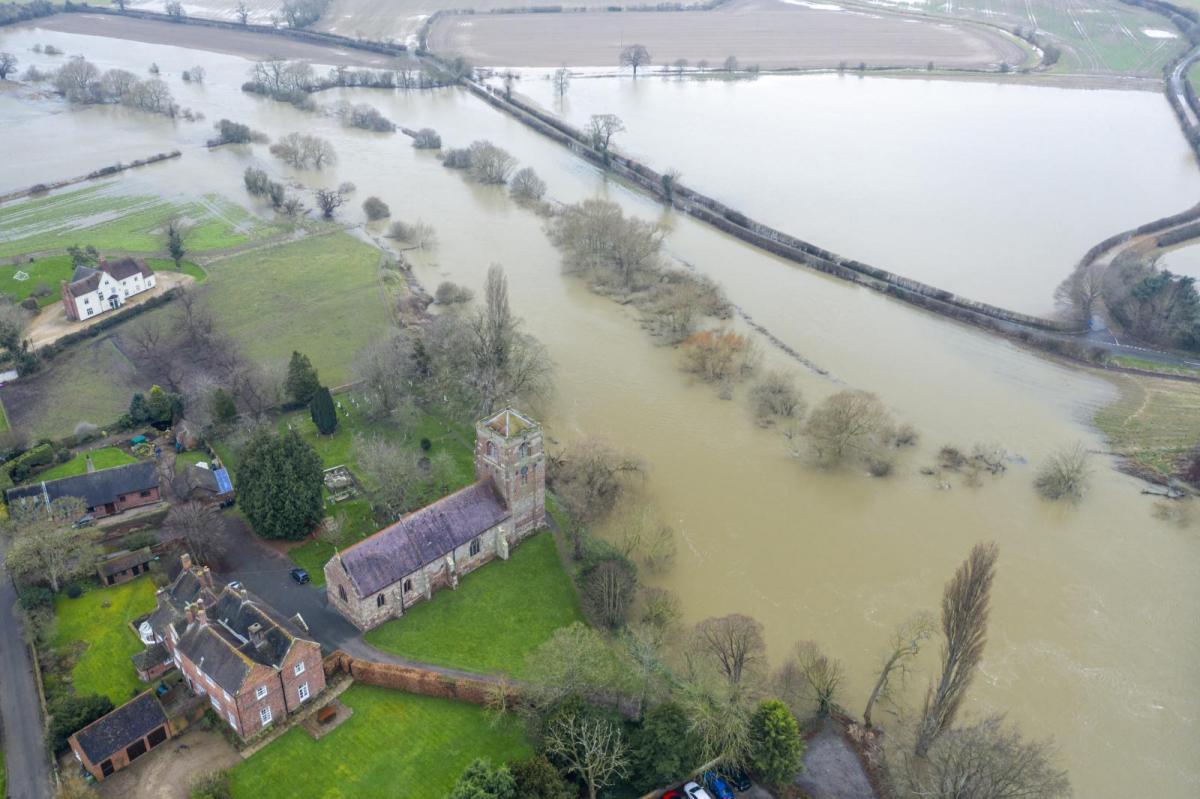
One of the most prominent ways in which stuck weather patterns manifest themselves is in extreme weather events. A few days of rain, wind or heat isn’t unusual or problematic. But drag the rain out for weeks or months, and you get widespread flooding (summer 2007). Storm after storm will produce significant coastal damage and storm surges (winter 2014-15). Weeks of heat and sunshine will produce drought and heat stress (summer 2018). These extreme episodes often result in significant economic losses and large insurance pay-outs. As such, re-insurance companies, like Munich Re, tend to keep a very close eye on destructive weather trends. The graph below is an example, displaying the number of natural loss events, basically natural disasters, between 1981 and 2018.
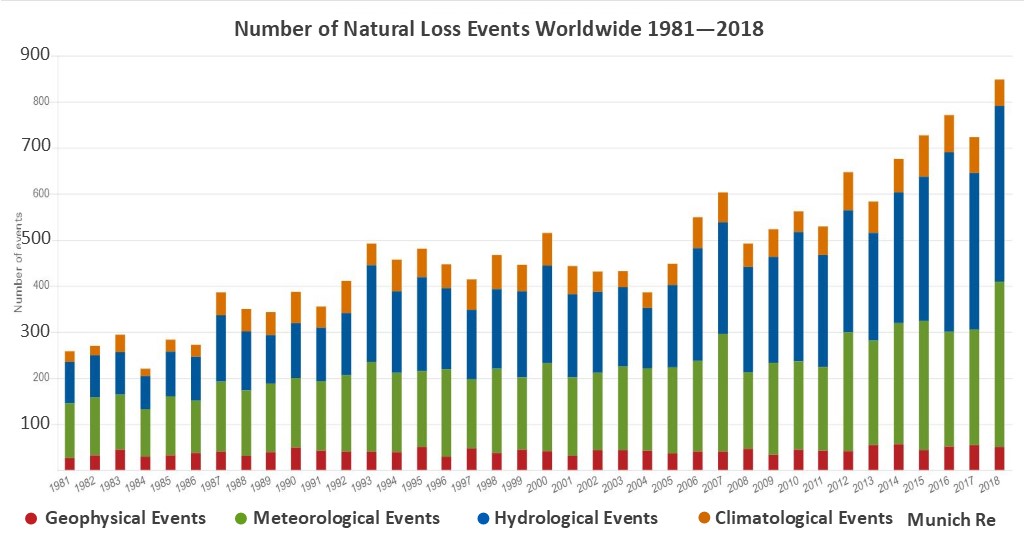 [Number of natural loss events as monitored by Munich Re]
The increase is very clear and is driven entirely by meteorological, climatological and hydrological events. The geophysical events (in red), which include earthquakes, tsunamis, volcanos, etc, have remained relatively stable.
There are also many scientific and government reports supportive of an increase in extremes. For example, the European Academics Science Advisory Council (EASAC) report trends in extreme weather. EASAC's Environment Programme Director, Michael Norton, says:
“There has been and continues to be a significant increase in the frequency of extreme weather events.”
The latest IPCC report also discusses extreme weather and climate events, noting an increase in many areas, such as extreme heat, rainfall, and drought:
“…there is medium confidence that the length or number of warm spells or heat waves has increased since the middle of the 20th century. It is likely that there have been statistically significant increases in the number of heavy precipitation events… …There is medium confidence that since the 1950s some regions of the world have experienced a trend to more intense and longer droughts.”
In order to explore why these “stuck” weather patterns are occurring, we first need to briefly look at the polar jet stream (For a detailed look at the jet stream, check out the great netweather tutorial here!). The jet stream forms as a result of the temperature difference between the cold polar air to the north and the warm tropical air to the south. Because warm air expands, the height of the tropical air is greater than the cold polar air. This means that the air in the tropics flows down a gradient towards the poles. The spin of the Earth then directs this air towards the right, resulting in the jet stream. Atmospheric instability and differential heating from east to west (such as continent vs ocean) creates other temperatures and pressure gradients, contributing towards its characteristic waviness. These large ridges and troughs that form the jet stream waves, called Rossby waves, traverse the mid-latitudes, producing phases of calm, high pressure conditions followed by unsettled, low pressure weather. When the gradient from the tropics to the poles is steep, like in winter, the jet stream acts like a river flowing down a mountain, fast moving with only shallow bends and curves. When the gradient is reduced, it acts more like a late stage river, flowing slowly with large meanders, like in summer.
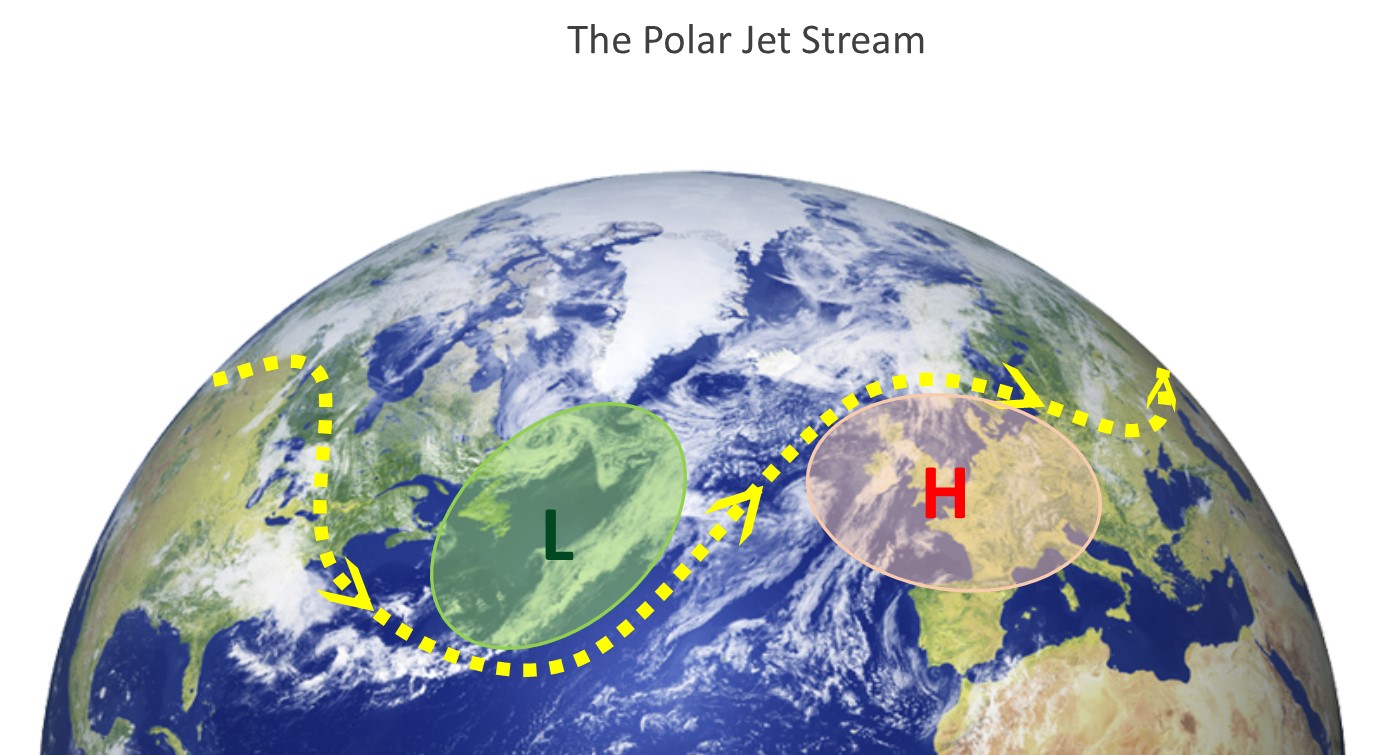 [Diagram of regular low amplitude jet stream]
How quickly these ridges and toughs move over us determines how long our weather types persist. If these Rossby waves grow, slowdown or get stuck, persistent and extreme weather can result. So, this leads to an important question. What is causing these Rossby waves to slow down, or get stuck?
As mentioned, the polar jet stream is faster when the temperature gradient between the tropics and the poles are greatest. One of the ways in which this gradient can be altered, is by warming the Arctic faster than the rest of the planet. Indeed, this has been occurring over the last few decades, in a process known as Arctic Amplification.
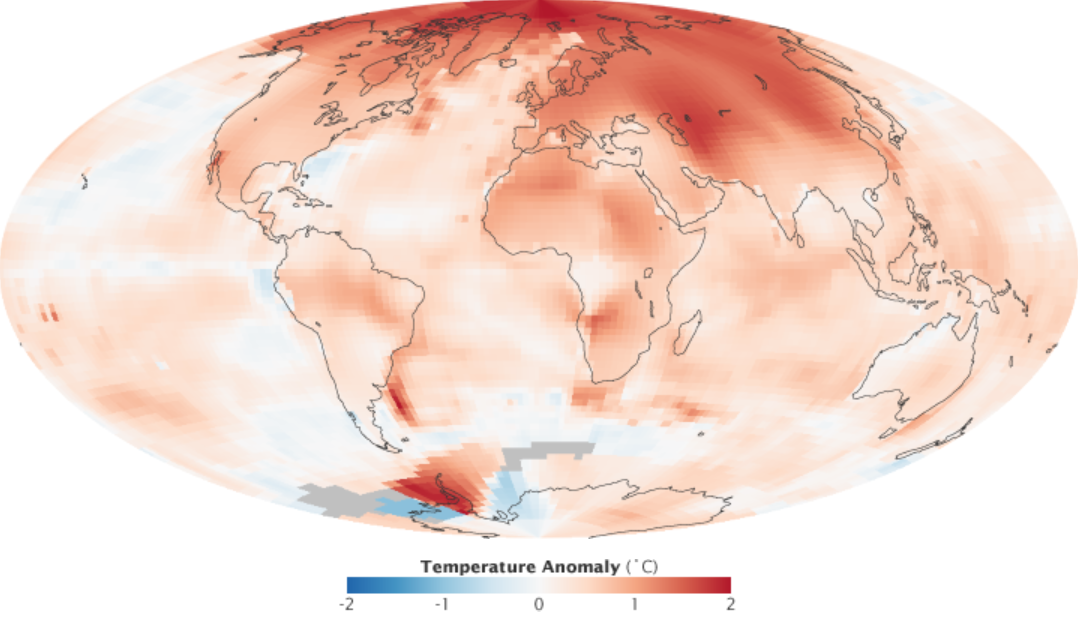 [Arctic Amplification show by the 2000-2009 Surface Air Temperature Anomaly: NASA GISS]
Numerous studies have described the mechanisms by which Arctic Amplification is contributing to the recent change in weather patterns. By warming the Arctic faster than the tropics, the temperature gradient is being reduced, increasing the size of the Rossby waves and slowing them down, resulting in more extreme weather patterns that also last longer (shown by the animation below).
[Effect of Arctic Amplification on the atmospheric pressure gradient and jet stream]
However, while there is a growing body of evidence for this theory, there isn’t a complete consensus just yet. Arctic Amplification has only reached a level capable of upsetting the temperature gradient in recent decades, a short time for trying to detect statistically significant trends in what is a fairly chaotic system.
Many of us are familiar with the SAI. The feverish tracking of Siberian snow cover during Autumn, hoping it may signal a cold and snowy winter in the UK. But how does it work, exactly? The basic idea is that enhanced snow cover over Siberia in Autumn strengthens the Siberian high pressure. This increases the chance of energy being sent both poleward and vertically, into the stratosphere, causing disruption of the polar stratospheric vortex. This disruption propagates downward, causing a negative Arctic Oscillation, weakening the polar jet stream and allowing more prolonged and extreme cold outbreaks. On top of this, it is theorised that the loss of Arctic sea ice and resulting warmth in Autumn is increasing the moisture content of the atmosphere, enhancing the Siberian snow cover in Autumn… so once again, Arctic Amplification is implicated!
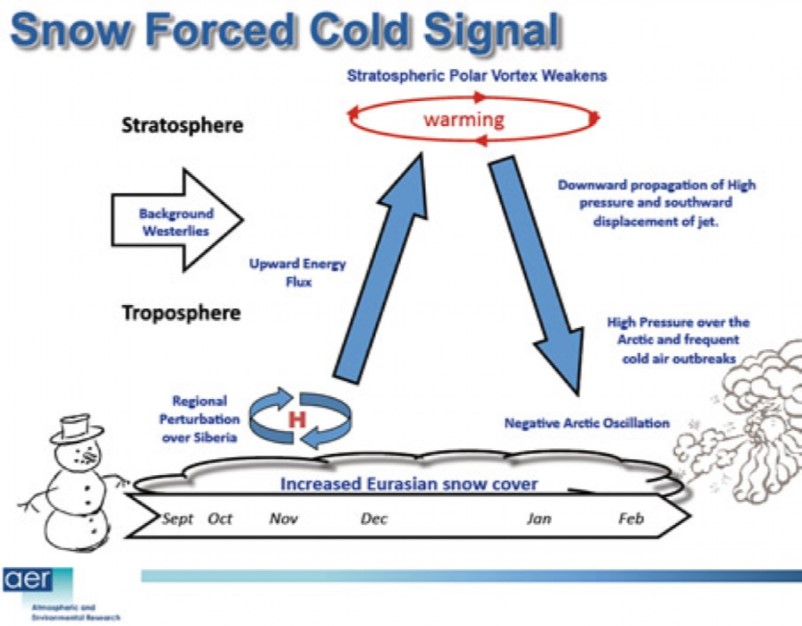 [Diagram depicting the SAI influence over the polar stratospheric vortex]
This is a tricky one to explain, but let’s give it a shot! As discussed, Rossby waves typically don’t stay in the same position for very long. Rather they zip around the planet, so we get caught in a wave trough for a few days, then a ridge, and so on and so on. However, because of how the oceans and continents are arranged, there are particular points around the mid-latitudes that create their own weak, stationary waves that can interact with the Rossby waves, slowing them down a little. This interaction becomes especially strong when the zonal wave number (the number of Rossby waves at any one time) is between 6 and 8, causing them to resonate with each other, amplify and get stuck – hence the name quasi-resonant amplification (QRA).
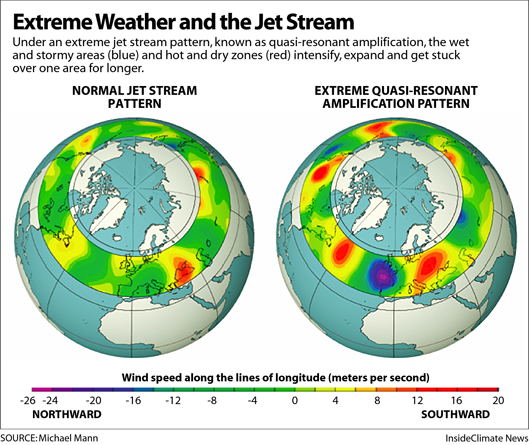 [A comparison of a regular jet stream on the left with an amplified jet stream on the right, using meridional (north to south) wind speed differences]
This process has been blamed for events such as the 2010 Russian heatwave and the Indus river flooding in Pakistan in 2003. Once more, like the others, QRA events have been increasing in the last 2 decades. In recent years, evidence has begun to emerge as to the cause of this increase…. You guessed it – Arctic Amplification!
That’s a quick run through the main processes that are believed to contribute to our increasingly stuck weather patterns. The sources and some extras, including a video describing the QRA theory, are provided below. However, there’s much more to consider, for example:
Hopefully we’ll manage to explore all of these questions in future articles. For the next in this series, we’ll go into more detail on how these processes operate during winter, and how they might evolve over the coming decades…
BBC article with the quote from Prof. Liz Bentley
Source of first image
Munich Re Natural Loss Events Tool
EASAC Report
EASAC Report on Science Daily
IPCC Chapter on Climate Extremes
NASA/GISS Arctic Amplification image
First paper linking Arctic Amplification with jet stream changes by Jennifer Francis
AER Snow Advance Index
Snow Advance Index Paper
First QRA paper
First QRA paper linking with Arctic Amplification
Inside Climate News QRA article
A short video explaining QRA