Samuel Hayes travelled to the Tuktoyaktuk in the western Canadian Arctic to research how climate change and ice melt is causing the collapse of the Arctic coastline.
For much of August 2017 I was in the western Canadian Arctic, in a small hamlet along the Arctic coast called Tuktoyaktuk, but generally referred to as “Tuk”. In the native Inuvialuit language, it translates to “looks like a caribou”, though I couldn’t personally spot the resemblance! In this village, the vast majority of the 850 residents are of native Inuvialuit descent, a rich and generous culture, full of stories and incredible local knowledge, who still engage in the traditional hunting of whales, bears, and caribou. A small community with no cafes, bars, restaurants, hotels or much else (aside from an abandoned hotel that Courtney Love is rumoured to have thrashed in the 80s), Tuk has been gaining investment from the Canadian government as a key location when it comes to Arctic geopolitics. In fact, Tuk got its first connecting road two years ago, finally linking it to the rest of Canada!
Tuk is also a major base for Arctic research. It offers an access point to many areas of interest to polar scientists, such as sea ice in the Beaufort Sea, beluga whale habitats, the Mackenzie Delta and, the topic that brought me to this remote Arctic location, access to some of the most rapidly eroding permafrost coastlines in the world.
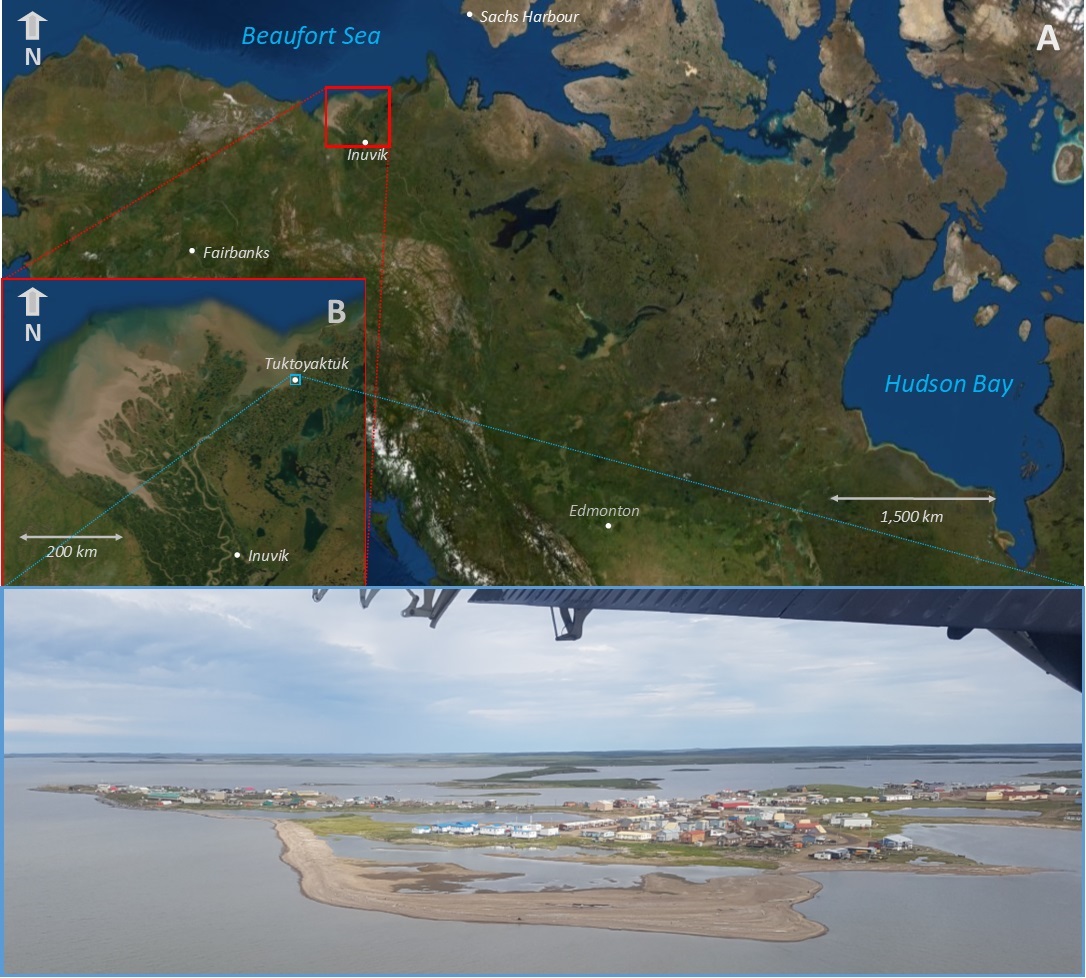 [The location of Tuktoyaktuk, near the Mackenzie Delta]
To understand why these coasts are eroding at such a fast and accelerating rate, it helps to know a few things about their physical properties. Many of the coasts in this region consist of loose sediment, bound together with ice. Ice, therefore, provides a rigid structure that gives the soil strength. However, if you melt the ice, then the soil loses cohesion. This causes it to slump, slide and collapse into the ocean, leaving the waves to finish it off. The vast majority of the erosion at these locations occurs during the summer and early Autumn, when the sea ice has retreated, and snow cover has melted away. When sea ice is locked in place, the coasts are largely protected from erosion, so any increase in the open water season length will cause substantial increases in retreat rates. At the same time, when you consider the rapidly warming climate, increased extreme rainfall events, all in combination with longer open water seasons, and you can start to understand why erosion rates are increasing so rapidly.
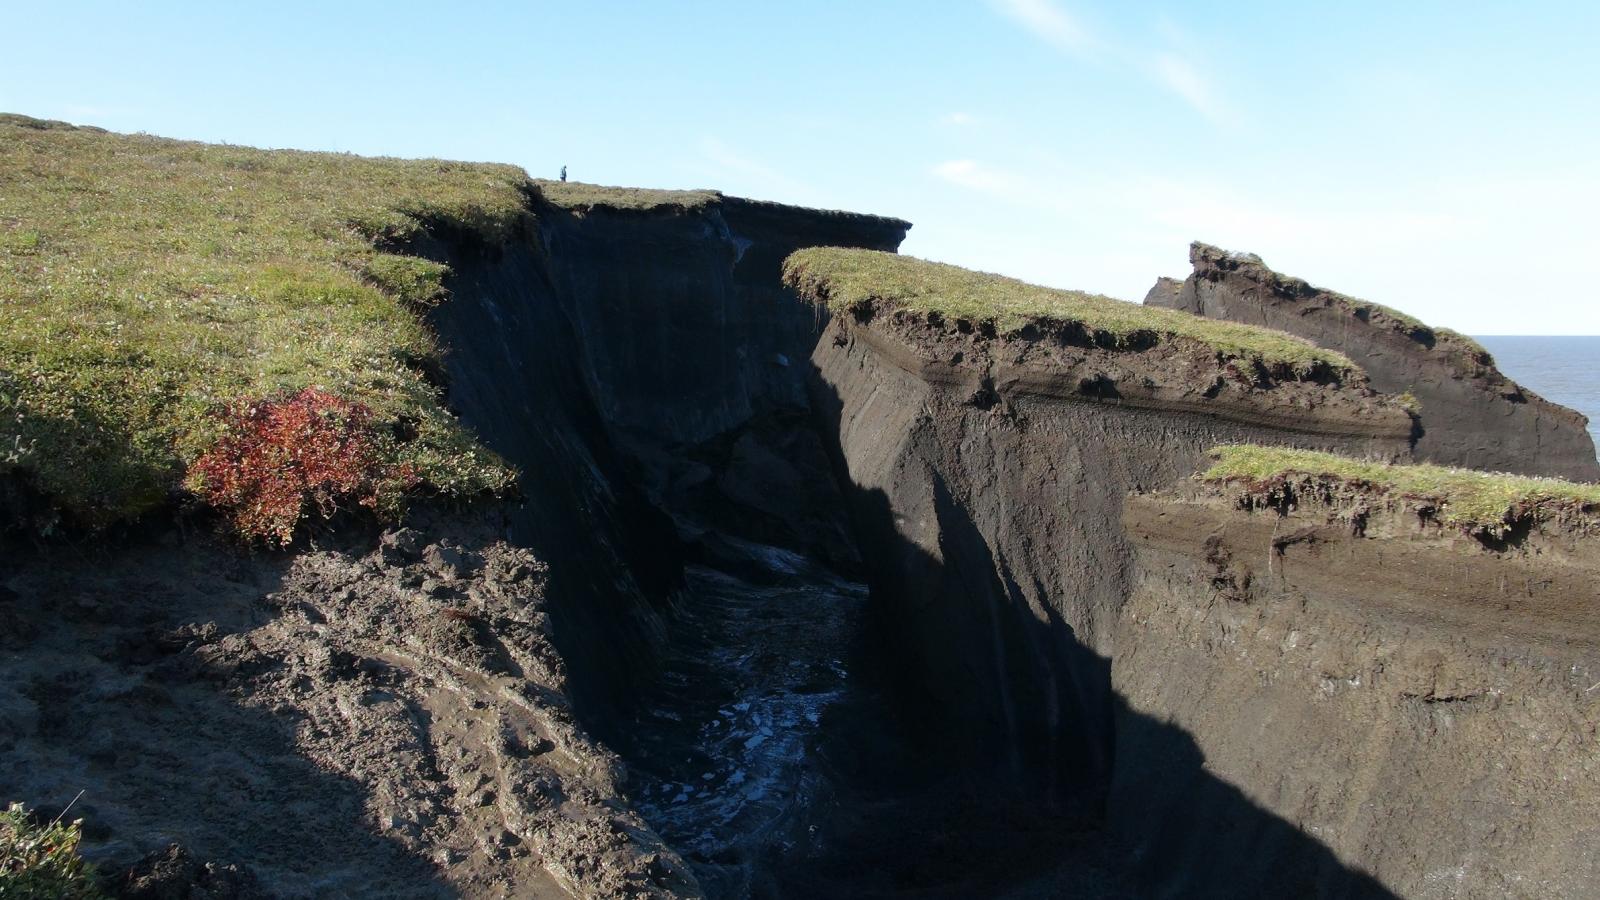
A fascinating aspect of permafrost erosion are the two unique types that occur along Arctic coasts. The first is block collapse. This is a process whereby waves and swells eat into the base of a cliff, both by thawing the soil with warm water and breaking it down with wave energy. This results in a notch extending into the base of the cliff, eventually causing the overhanging block to collapse. This form of erosion is associated with some of the fastest retreating coasts, especially in Alaska, but it’s also relatively well understood, with different models capable of simulating the process.
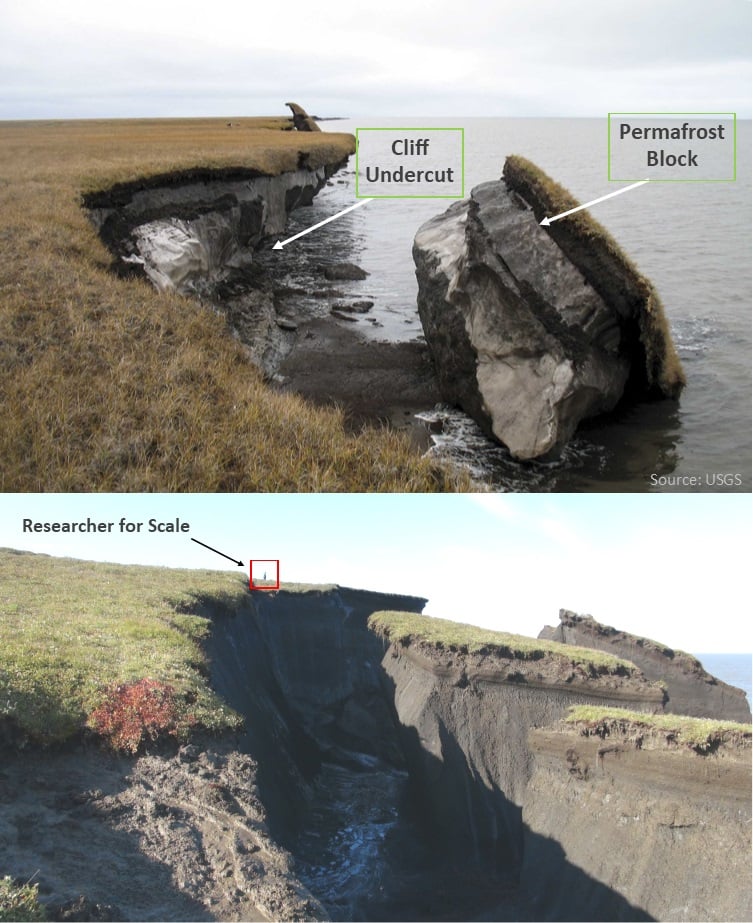 [Examples of coasts undergoing block collapse from (top) Alaska and (bottom) Pelly Island]
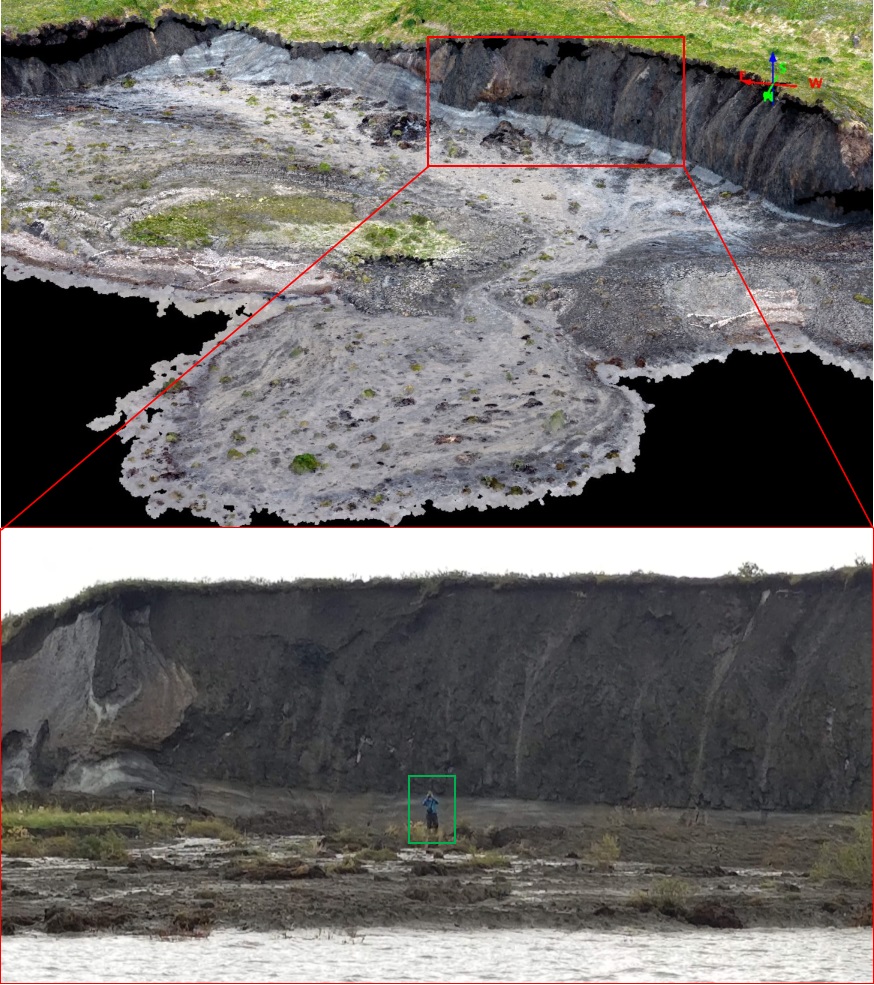
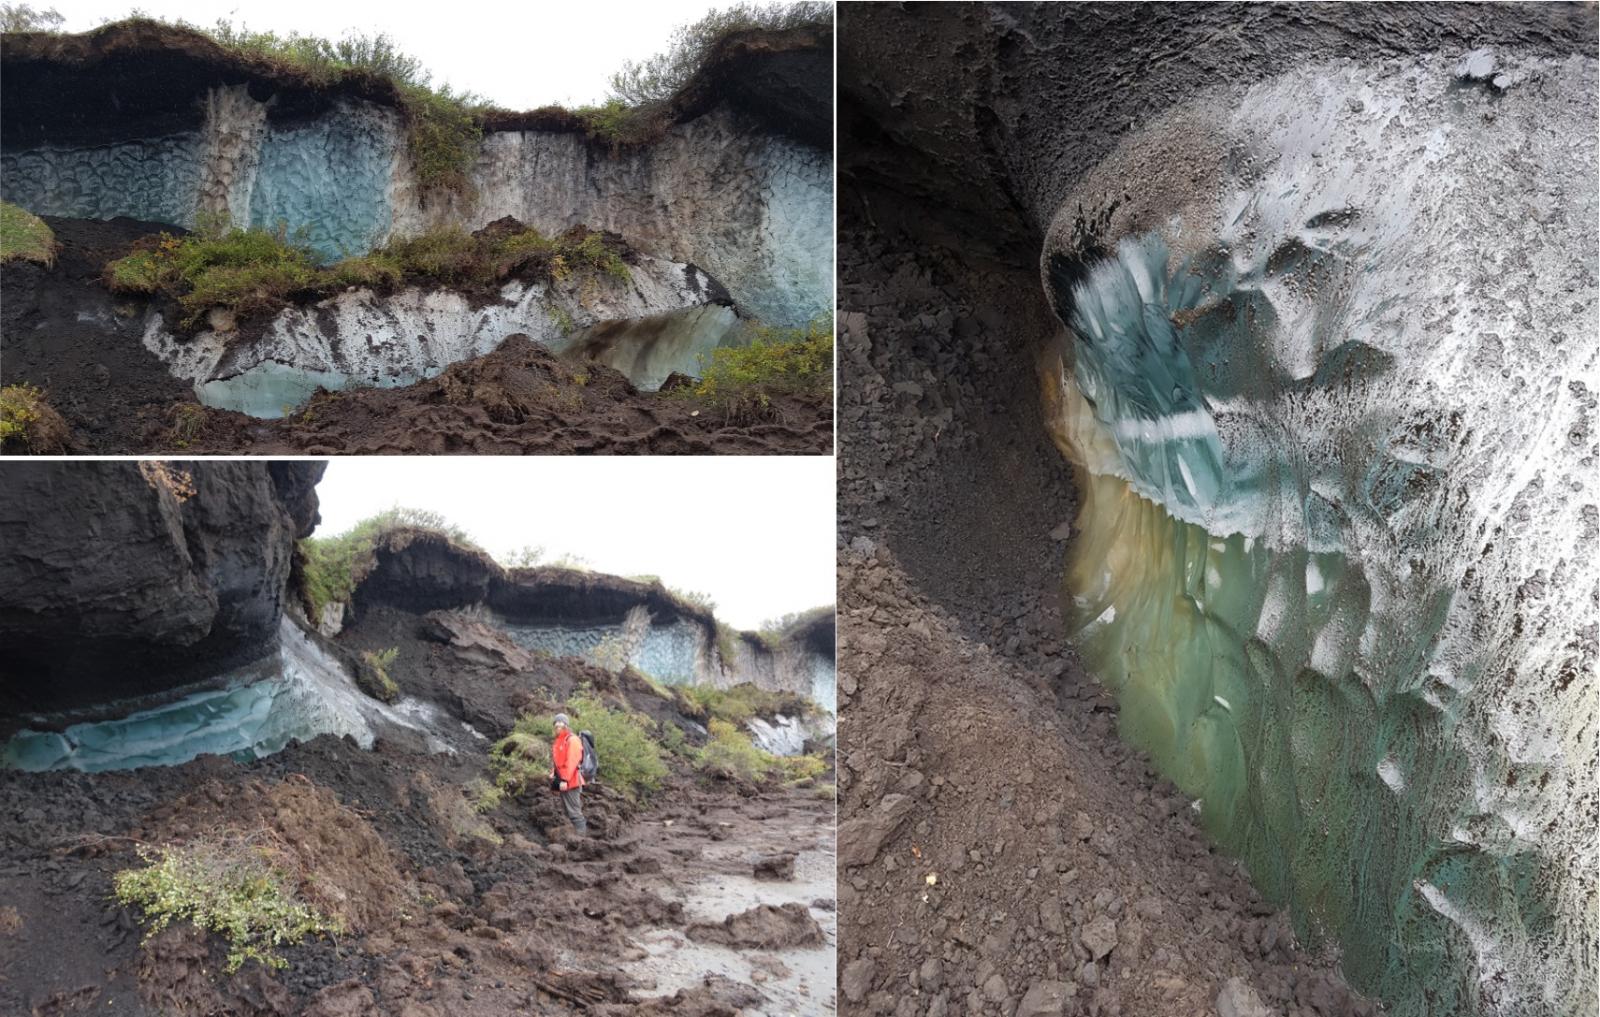
The other unique form of erosion is called a Retrogressive Thaw Slump (referred to as just “thaw slump” hereafter). These feature dramatic-looking “C” shaped scar zones that can be up to 1km across, capable of extending inland by over 50 m in a single year, transferring vast quantities of soil into the nearby seas, lakes or rivers. They feature another unique characteristic of permafrost soil — thick layers of ice within the soil, known as massive ice bodies. When these ice layers become exposed to external energy fluxes, they start to thaw, and the permafrost soil above them crumbles, mixing with the meltwater from the thawing ice layer and forming large mudflows. The size and number of these thaw slumps have grown so dramatically in the last few decades, that they are described as being the dominant cause of landscape change in the western Canadian Arctic. For example, on the nearby Banks Island, there were only 64 thaw slumps observed in 1984. By 2015, this had increased to more than 4,000. By 2075, an additional 10,000 more are expected to form here each decade! However, despite thaw slumps transforming the landscape in such a dramatic fashion, they are not very well understood.
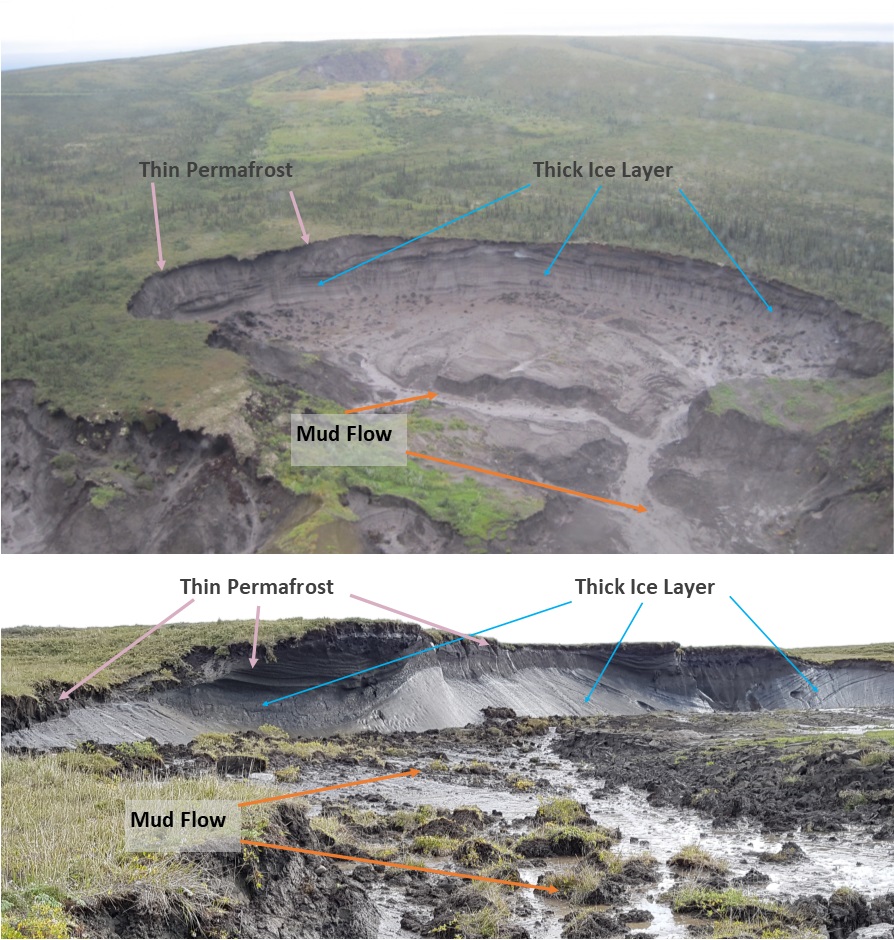 [Example of a thaw slump (top) and the main features (bottom).]
While all of this stuff is interesting from a scientific perspective, a valid question might be: Why study this at all? Does it even matter? Well, this is an issue affecting everything from ocean geochemistry, to fisheries and infrastructure. And for the people living out here, this isn’t a topic of purely academic interest—this affects their homes, livelihoods, and heritage. Sediment transport from thawing, eroding permafrost is changing the nutrient balance, affecting fish species, promoting algal blooms and increasing ocean acidification rates. So much carbon is entering the shallow seas that during the coming century, large parts of the Arctic ocean may switch from being a net carbon absorber to an emitter, with implications for the global climate. And perhaps the most critical issue for Tuk, erosion of the island that has historically acted as a protective barrier will leave much of Tuk village exposed to powerful Arctic storms, further increasing the land loss for the village, destroying homes and property. So overall, it is of huge importance to properly understand the processes governing these coastal changes.
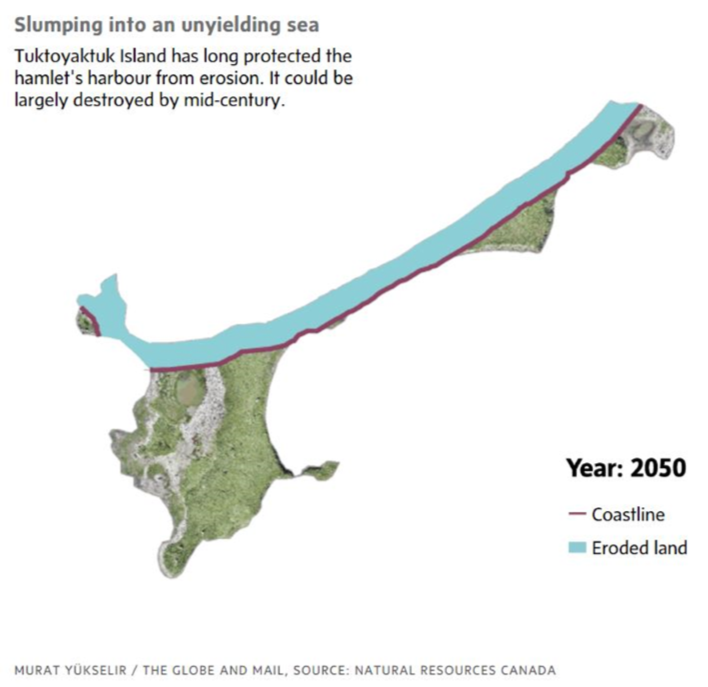 [Estimated loss of land on Tuktoyaktuk Island by 2050]
Interestingly, netweather played a large role in me, eventually ending up in Tuk! When I joined the forum, back in 2007, I had just started at University College Cork, studying environmental and earth system science. In Autumn of 2007, Arctic sea ice hit a new record low, and there was lots of discussion in the climate area of the forum, which I began to read regularly. Through the links posted, discussions, arguments and J10’s excellent sea ice updates, I began to develop a strong interest in Arctic sea ice — my undergrad dissertation was even based on sea ice! From there, my interests began to broaden to all aspects of Arctic climate change. I did a masters working satellite imagery, mapping and spatial analysis, and I started my PhD at Northumbria University at the end of 2016, where improving our understanding of thaw slumps became the focus. Then in August 2017, thanks to funding from INTERACT and NERC, I finally made it out for some fieldwork, along with my supervisor, Dr. Mike Lim. We also collaborated with a fantastic team from Natural Resources Canada (NRCan), led by Dustin Whalen, that provided guidance, tips, contacts and even a few free helicopter trips!
The unique thing about our whole research team was the number of novel technologies and techniques we were applying to these dynamic coasts. One of the most important pieces of info needed was detailed 3D surface models so that we could analyse how the ground surface varies (like slope angle and elevation), and how that influences thaw slump activity, coastal retreat rates and other similar processes. This was primarily achieved using a rather cool approach called Structure from Motion (SfM). This is based on the principle that if you take photos of an object from different angles, you can reconstruct its 3D geometry. In the field, we do this by taking thousands of photos using basic consumer-grade drones. The photos are then processed to create 3D surface models with the visual imagery included, after which topographic analysis and change detection can be carried out. Thanks to the NRCan team, we had the drone imagery and models for 2016, 2017 and 2018, supplemented with different, lower resolution surface models from 2004 and 1994 also.
 [Section of field site Peninsula Point SfM model (top) and photo for scale (bottom).]
An important issue I wanted to solve was that of mapping the massive ice layers without using invasive methods like boreholes. This was something never previously done, so we decided to experiment with a nifty little device called a Tromino™, that measures naturally occurring seismic noise. By analysing the seismic signal, it’s possible to detect the subsurface layering, such as how deep the ice is, and how thick the permafrost covering it is. This kind of info is vital in figuring out where thaw slumps might occur, and when they do, how much of the volume lost will be soil (and associated carbon) vs just ice.
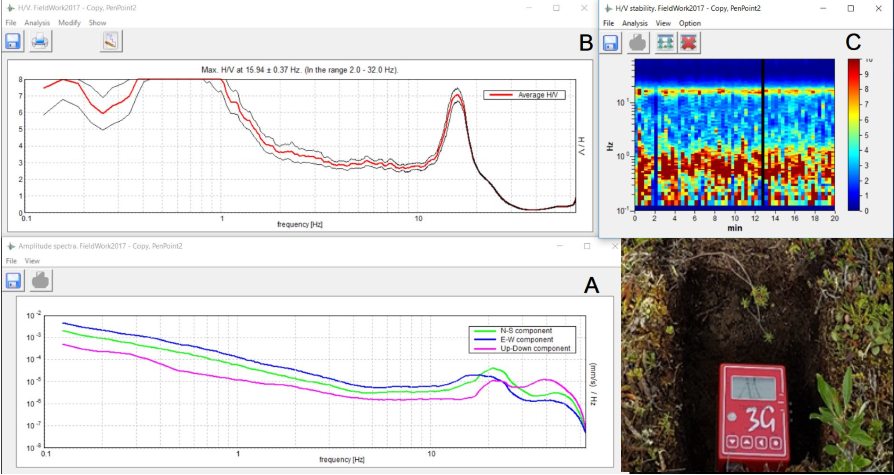 [Tromino device (bottom right) and processing of the seismic signal]
A bunch of other fancy, and not so fancy, gadgets were also employed, like thermal cameras, time-lapse cameras, temperature sensors, soil salinity and grain size measurements and more. Added to all that was the analysis of loads of satellite and aerial imagery to create long term records of coastal retreat, and climate analysis to see what the temperature and wind trends were like. Our collaborators were also testing out some exciting new technologies, such as IVER, an autonomous underwater vehicle capable of running in ocean or freshwater for up to 30 minutes at a time. They’ve also employed seabed instruments to monitor sedimentation flows, and various other oceanographic instruments collecting data on water temperatures, waves heights and even recording beluga whale calls!
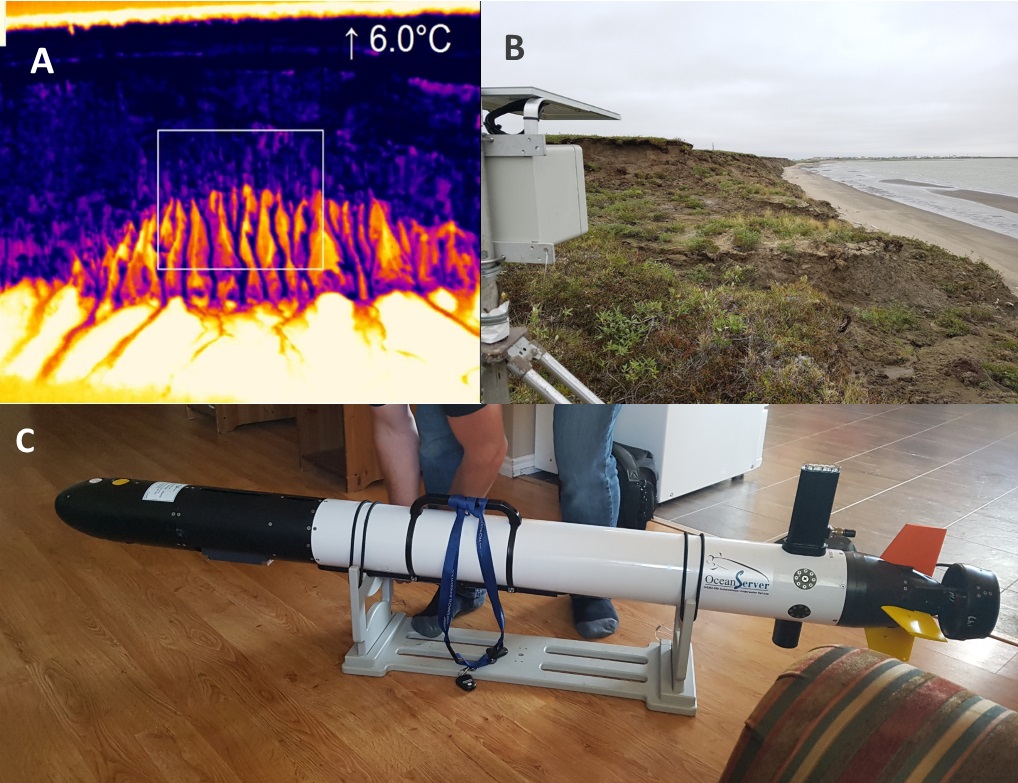 [Thermal camera imagery (A), solar time-lapse camera on Tuk Island (B) and (C) the autonomous underwater vehicle IVER]
The site, Peninsula Point, became the focus of my research because it had lots of elevation variation, exposures of ice layers, different sized thaw slumps and a history of monitoring all the way back to 1935. However, we visited several other sites with some impressive and bizarre features, which I’ll quickly show below.
Tuktoyaktuk is surrounded by pingos; it even has a national park dedicated to pingos just to its west called, aptly enough, Pingo National Park. These are mounds of ice that grow at just a few mm per year, reaching heights of dozens of meters. Tuktoyaktuk has the 2nd tallest pingo in the world, at 49 m. The ice inside these pingos can be quite spectacular when freshly exposed, with a range of colours and patterns. Due to the high ice content, these pingos erode very quickly once the ocean reaches them, so who knows if it will even last beyond a few more years?
 [Pingo Ice]
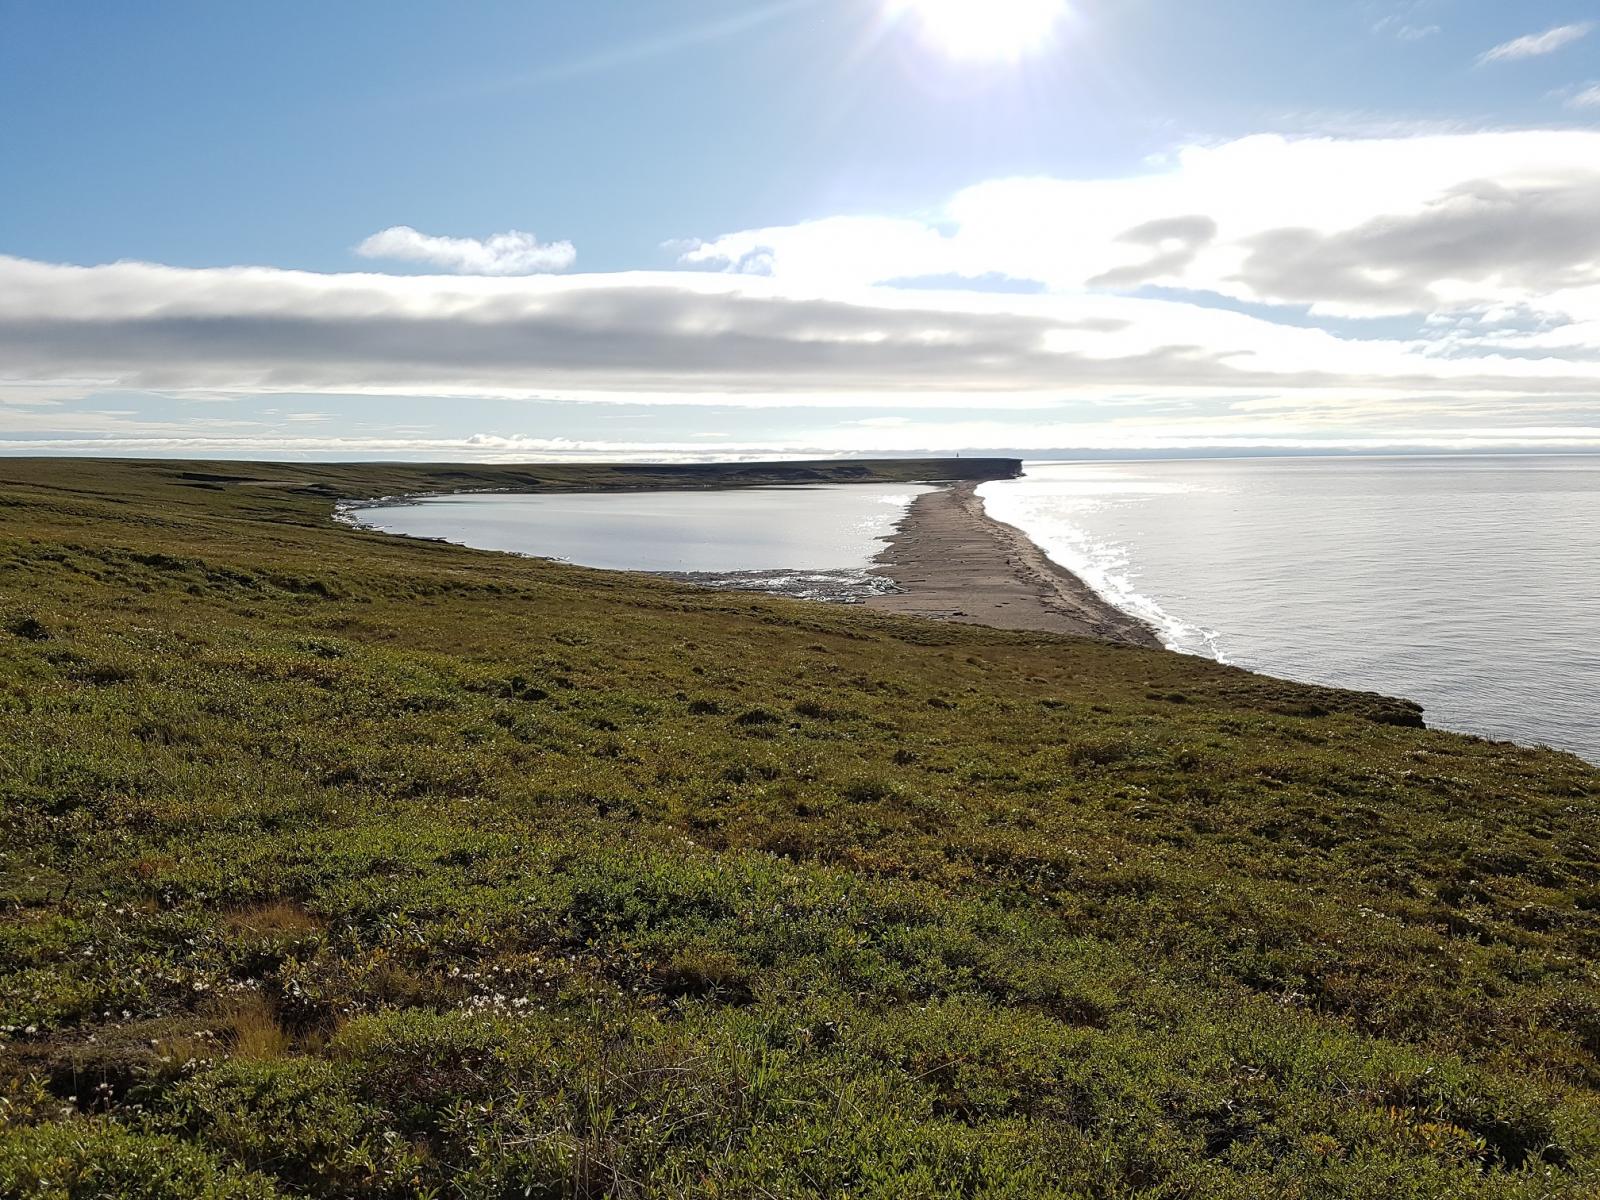
Pelly Island, on the northern edge of the Mackenzie Delta, was the site furthest from Tuk that we visited, and is one of the fastest eroding locations in the entire Arctic, losing 45 m in 2016 alone. It’s got cliff sections, up to 40 m tall that are undergoing block collapse. The result is these massive blocks, separated from the coast by only a few meters, that look truly spectacular.
 [Large collapsed permafrost blocks on Pelly Island]
Pelly island, on the warm sunny day we travelled there, is a stunning location in itself. With two large block collapse sections on either end of the island linked by a narrow beach with a lake just inshore. Combined with 24-hour daylight around the summer solstice, and even 19-20 hours of daylight by the end of August, would this not be a great sun holiday destination?
 [The undiscovered holiday paradise of Pelly Island]
This thawing permafrost landscape often appears bizarrely alien, something highlighted when viewed from the air. Having the opportunity to fly across much of the region, here are some interesting shots captured during the few weeks. In the images below, A is one of the pingos mentioned earlier – large mounds of slowly growing ice. B show some thermokarst (a term for thawing permafrost) lakes, with different colours due to sediment input, and sometimes nutrients promoting phytoplankton blooms. C is patterned ground, a polygonal structure formed due to the presence of wedge-shaped bodies of ice extending underground.
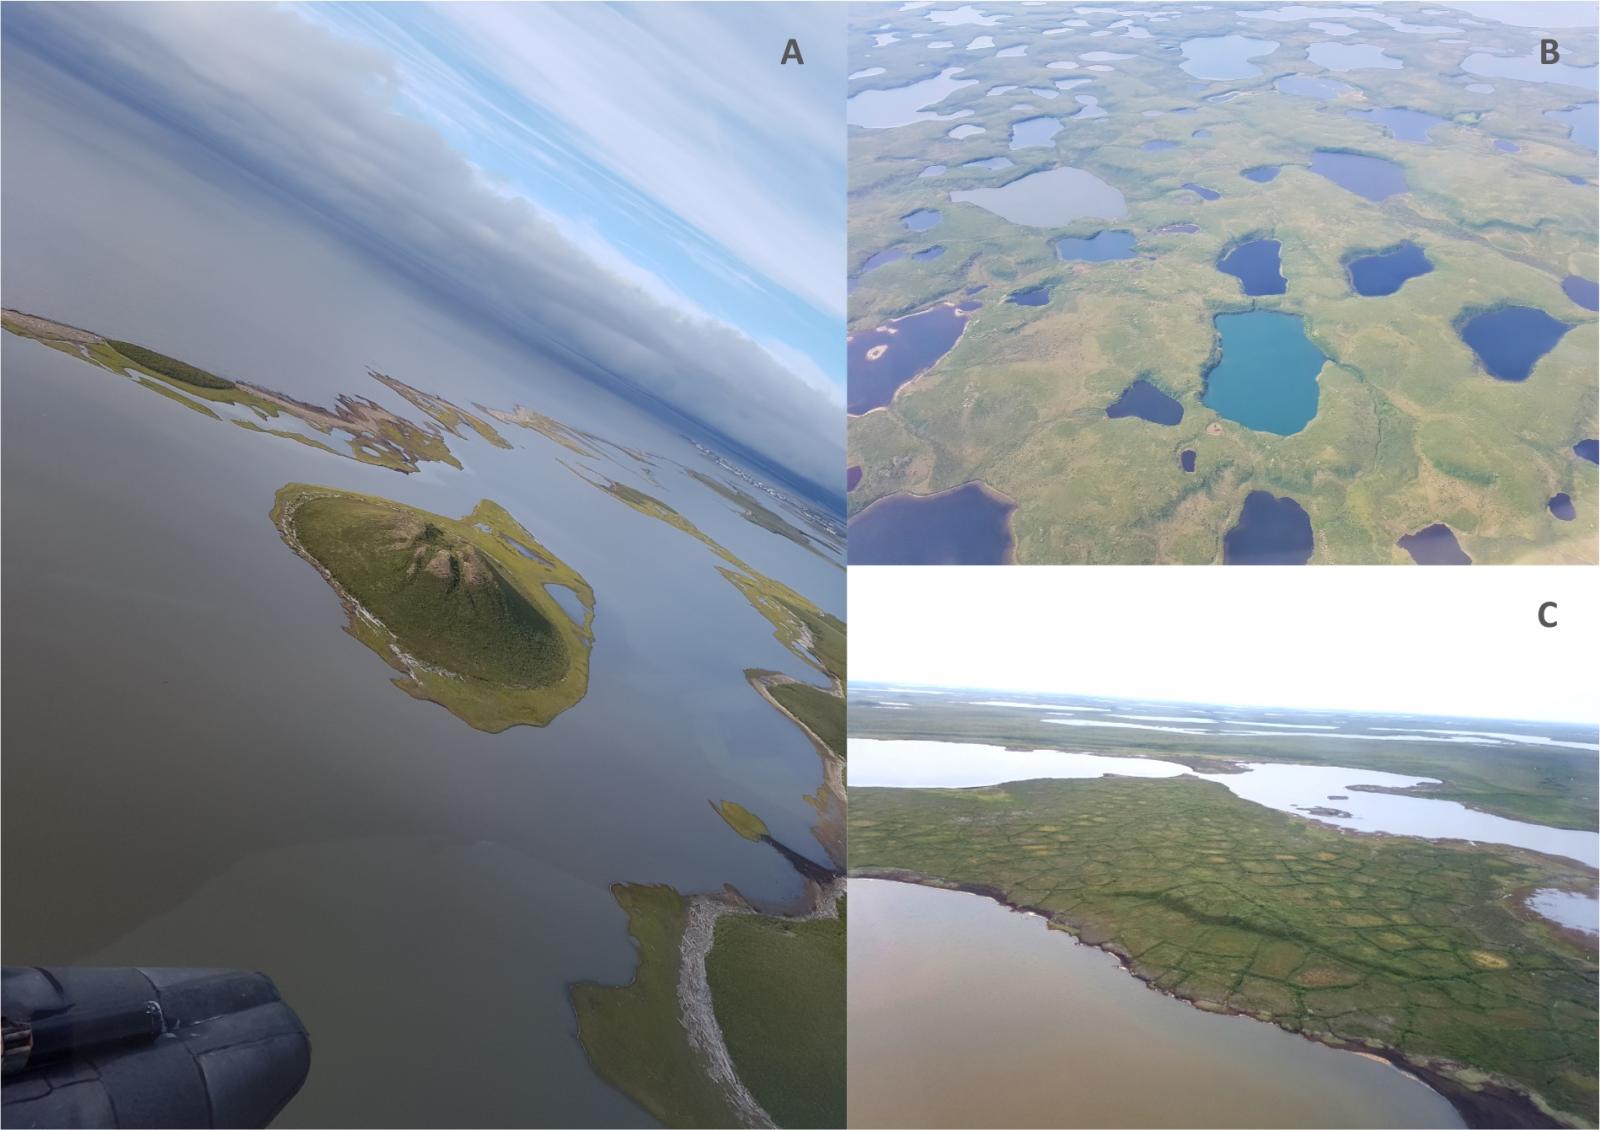 [A Pingo near Tuktoyaktuk (A), colourful thermokarst lakes (B) and ice-wedge polygons or patterned ground (C)]
On Peninsula Point, the primary research site, I had 3D data from 2017, volume data from 2004 to 2018, topographic data from 1994 to 2018, shoreline positions from 1935 to 2018. With all of this data, I could then compare, contrast and correlate to see how all the different aspects interact and influence each other. From this, many new relationships were discovered that can help to both anticipate how these coasts will evolve over the coming decades, and how they’ve changed over the last century.
One of the most novel findings was that the passive seismic data really works and is a new way to quickly and easily detect buried ice! This can be deployed around villages, historic sites and other vulnerable areas to detect the depth to ice and calculate the risk of thaw slumps forming and damaging the area.
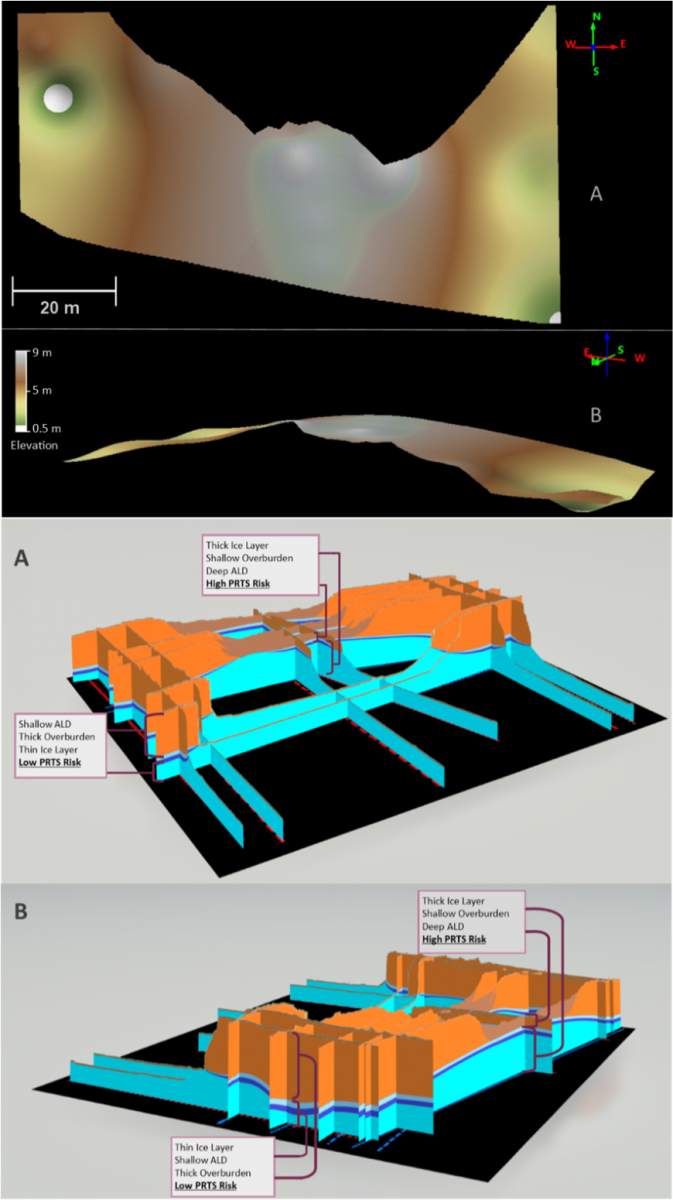 [Model of the ice layer surface elevation (top 2 images), and a 3D fence diagram showing the subsurface layer thickness (bottom 2 images).]
Using all the topographic and ice layer data, a bunch on simple conceptual models were also created, highlighting how the presence of ice layers in the ground can have a huge effect on the shoreline position, volume loss and much more.
 [Conceptual model for a simple, uniform ice layer (left) and some examples of these processes from Peninsula Point study site (right)]
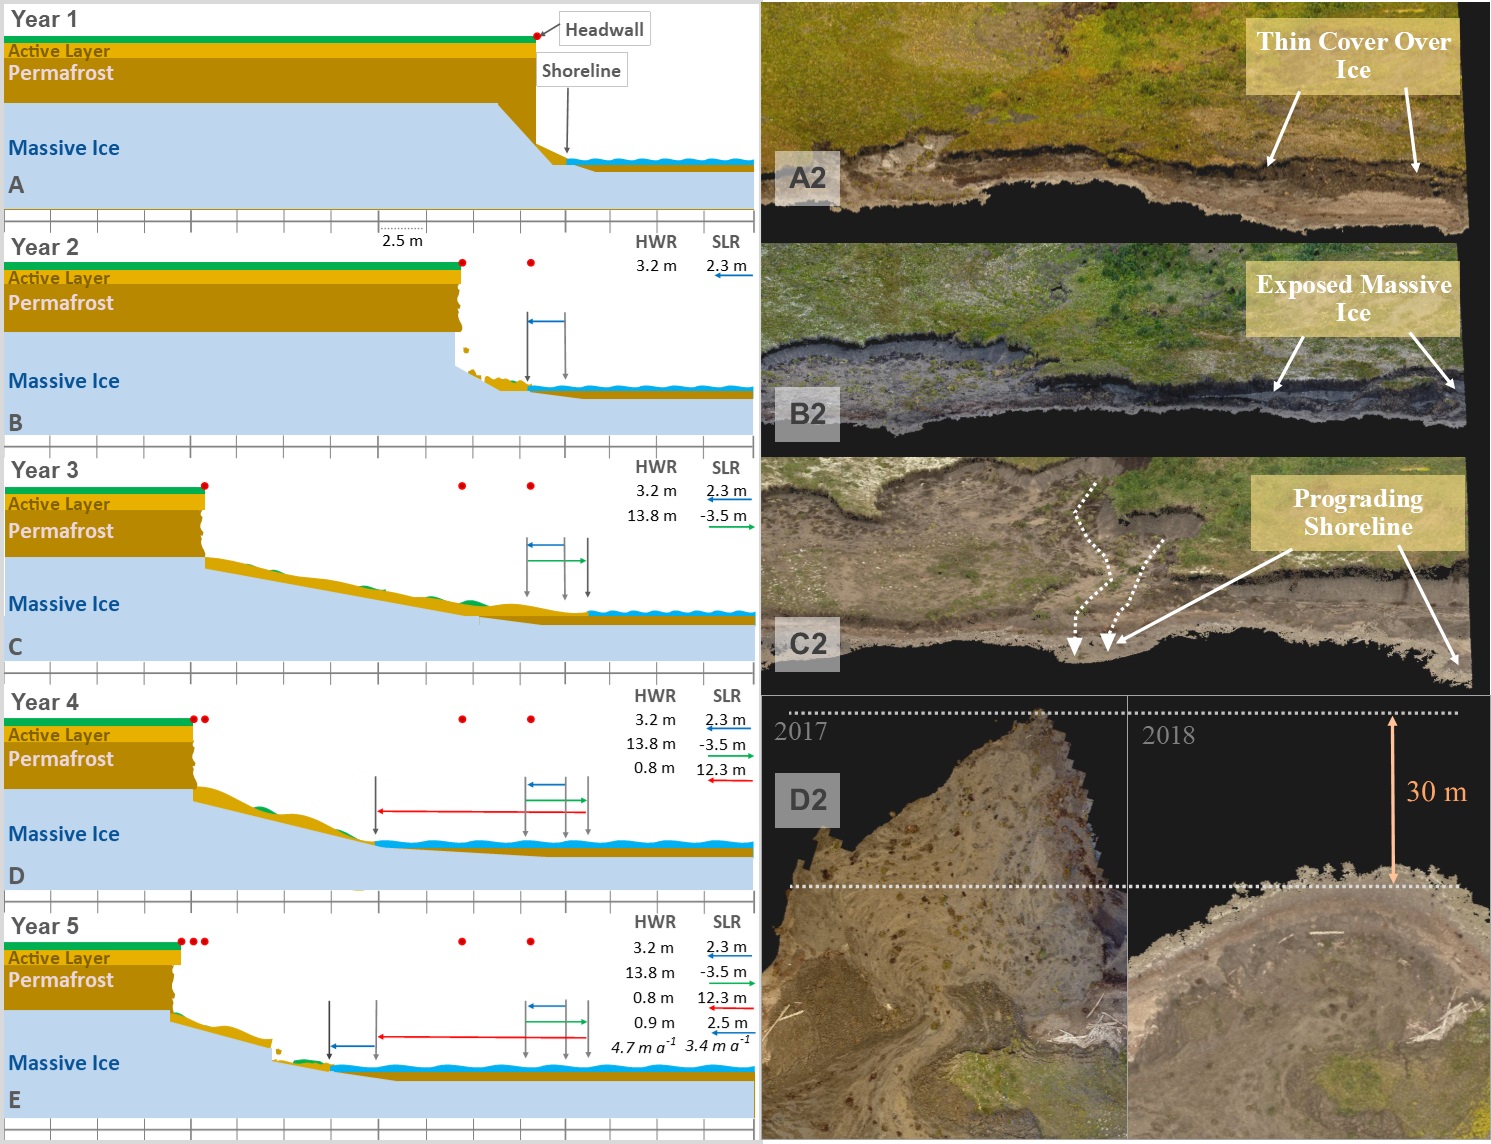
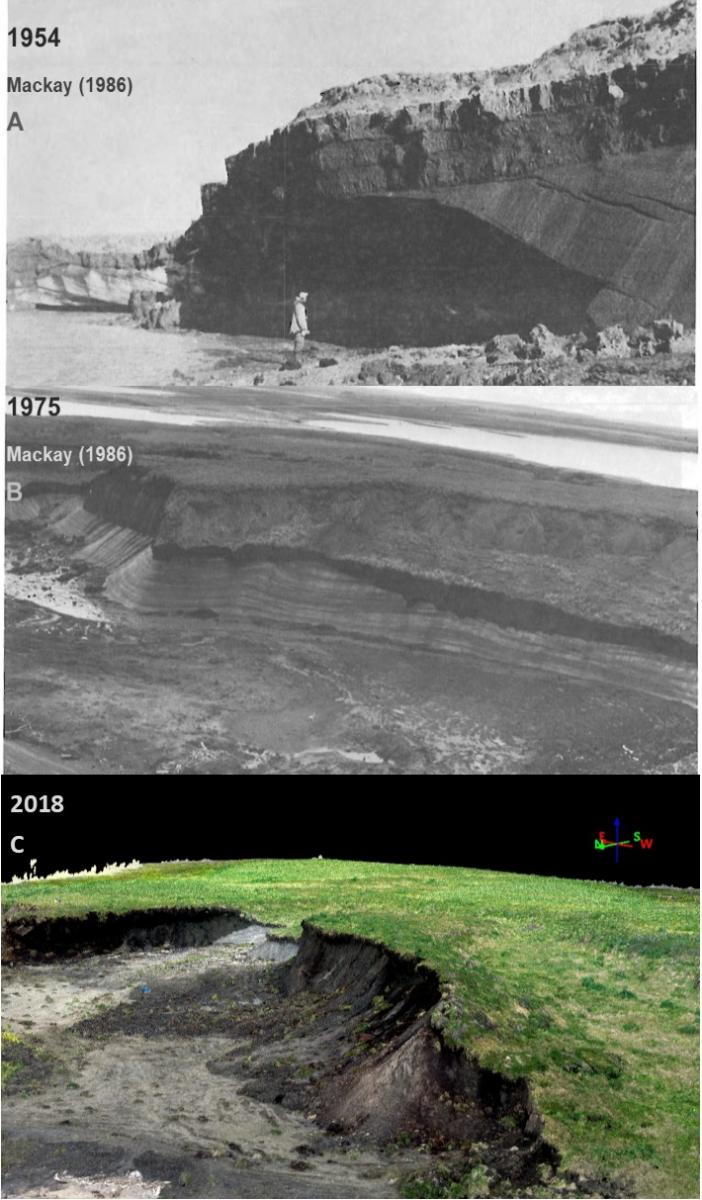
One of the most unexpected findings was that the rate of coastal retreat on Peninsula Point had slowed in recent decades, contrary to expectations. Trawling through old reports and photos, it appears the thickness and distribution of the ice layer has drastically reduced. Throughout the 20th century, there were widespread layers of ice up to 10 m thick across the cliffs. By 2018, the ice was typically thin and patchy, with a maximum thickness of just 3.8 m. This led to the conclusion that the reduction in ice has counteracted the warming climate, slowing rather than accelerating the coastal retreat rate. This is another finding with important implications for other regions with these thick ice layers – does the thick ice persist inland? If not, the coastal retreat may slow, if it does, the retreat may accelerate. But now with the passive seismic proven capable of detecting the ice, other researchers can apply it to their coastal areas and figure out what the likely scenario is.
 [Change of thickness and distributions of ice over time, 20th century vs 2018]
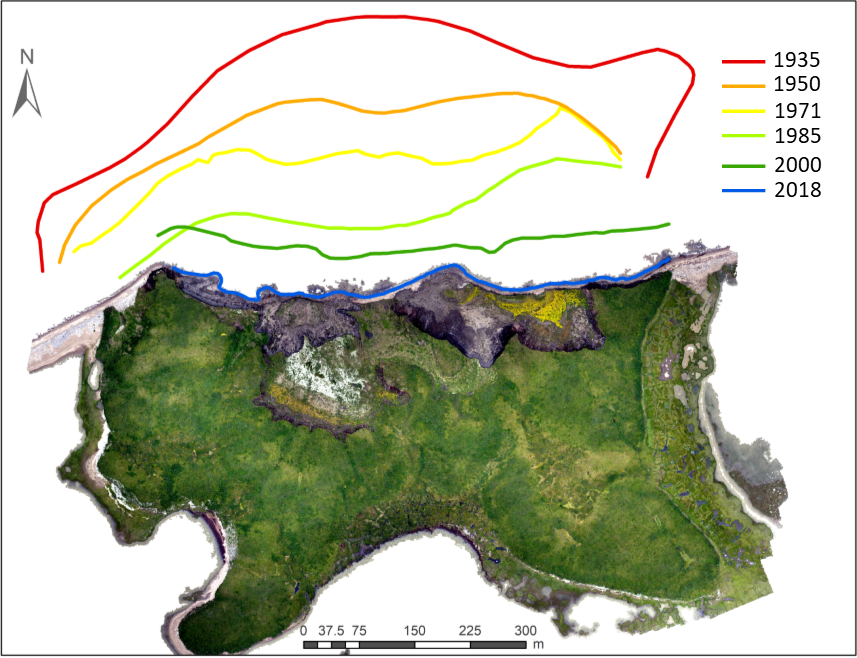 [North shoreline change from 1935 to 2018 on Peninsula Point]
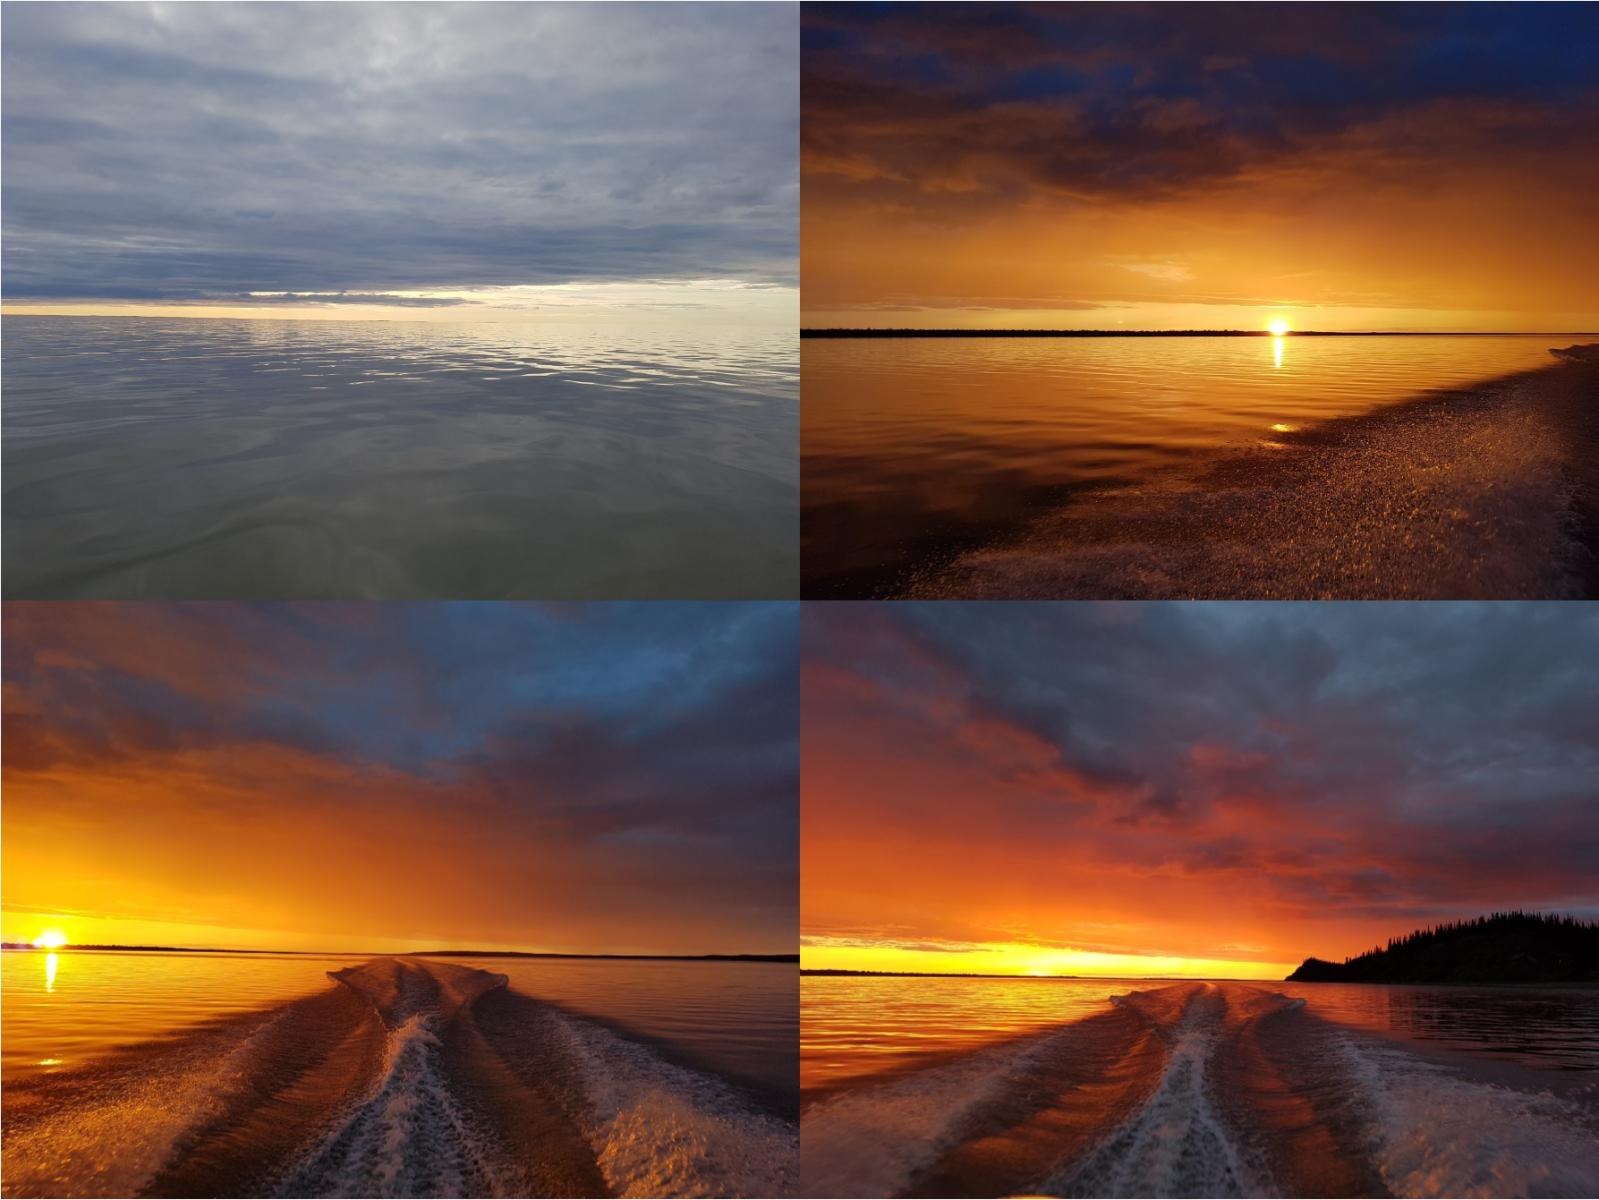
And that’s about it. For now, I’m finishing my thesis corrections and working on getting a few papers published from the work, whilst keeping my eyes peeled for any interesting post-doctoral positions. I’ll leave you with some final pictures. We had to return to Inuvik via boat through the Mackenzie Delta on the final day. The journey was nearly 5 hours and was during sunset, which also lasts about 3-4 hours at that time of year. This resulted in the most incredibly colourful sunset I’ve ever witnessed!
Acceleration of thaw slump activity in glaciated landscapes of the Western Canadian Arctic[PDF]
Extremes of summer climate trigger thousands of thermokarst landslides in a High Arctic environment
Tuktoyaktuk teetering: Hamlet’s shoreline erosion a warning to rest of Canada’s North