Oh the weather outside is frightful, Let it snow!
Ah, it's winter and there’s a chill in the air, but when will it snow is the question on many peoples’ minds. Love it and can’t wait to get the sledge out, or hate it and you’re dreading the slushy cold mess, at some point over the next few months, many parts of the UK should at least see some of the white stuff.
- Environmental factors
- Satellite nowcasting
- Thickness charts
- Boyden snow predictor
If you want to start having a look for a snowy setup
What should you be looking for in the forecasting charts?
Right time of yearThere are always random tales of snow in summer but November through to March stand more of a chance in the UK (October to April for Scotland). The earth is beginning to cool down beneath our feet and less sunlight over the northern hemisphere is leading to lower air temperatures.
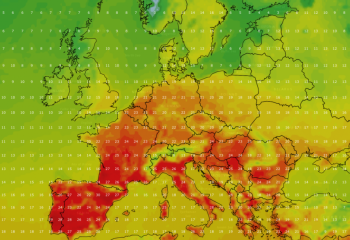
Cold airForecasters talk of a “plunge of cold air”. You may have seen bright blue thickness charts bandied about showing an area of colder air coming over the UK. It can be that air from Polar/Arctic areas or Siberia coming over the UK will allow temperatures to plummet and be a good tick on the snow making list.
Precipitation – This covers rain, snow, hail etc. If the UK is sitting in the middle of a large, dry, cold high pressure there needs to something else to produce the precipitation. Otherwise, you are just cold. This can be a polar low, showers set off over the sea, a frontal system coming up against the cold air. Also heavy precipitation can pull the air temp down, so forcing +2C air to -1C and the heavy rain begins to turn to snow.
Altitude/LatitudeCairngorm gets much more snow than Exmoor, which gets more snow than Isle of Wight. Height above sea level affects the air temperature and how far north or south you are in the UK affects your sunlight and so warmth in the winter. Coastal areas sometimes don’t get so much snow (see wind direction) but the North Sea can provide some of the heaviest snow falls.
Just because snow is mentioned for the Scottish mountains, especially this early on, don’t go thinking that the Midlands are going to be seeing a dumping.
Wind direction Water cools at a different rate to the land, so the seas around the UK can be much warmer than the land, with this temperature lull. At times, if the breeze is off the sea, it can warm the lower levels of the atmosphere with its contact with the sea. = rain. If breeze is coming over cold land mass can = snow.
The image below shows clearly 'Cheshire Gap scenario' A local feature, where winds are funnelled through a gap by Snowdonia, the Moors, uplift occurs and in the NW wind the showers (snow showers in this case Winter 2000) progress through the Midlands and sometimes further, so Essex could have seen some surprising snow on this day.

In the shorter term, there are forecasting methods to help predict more detail. I will be updating this blog and going into those in the next weeks. I’ll also be adding some example charts showing promising setups to look for.

Thurs 21st Nov
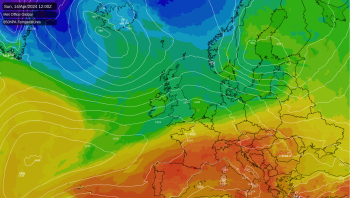
There has been brief snow overnight, mainly higher ground of northern England. Below is the 1000-500 thickness chart for this morning. It shows a cold pool, over Kent with thicknesses lower than 528 (dam). Thickness is a really easy way to spot the possibility of snow. the 528 line being a good starting point. There is precipitation showing on the radar in SE England, so with any height there is the possibility of wintriness today.

Thickness charts show where there is cold dense air and warmer less dense air, taking up more room. If you had a column of cold air, the particles would be closer together, taking up less volume. Warmer air has more energetic air particles, which take up more space, more volume. If you were to look at the air over the UK as a blanket, the thickness of that blanket vary with the temperature of the air. Thin bit of blanket with cold air, fatter bit created by warmer air. The levels are measured by looking up to 850hPa or 500hPa and these charts are available on Netweather.
Below the 850-1000hPa Thickness chart

The 500-1000hPa thickness can be used as an easy rule of thumb, over 528DAM chance of snow.
The 850-1000hPa charts can be used in a calculation called
Boyden's technique which uses your altitude to give a more specific % chance of snow. To use the Boyden technique for predicting snow
Update 25th Nov
You will need your height above Sea Level (s.l.)in feet
I’m going to use the village I used to live in Banffshire (snowest area in UK). I used
www.streetmap.co.uk as the 10m contours are clearly marked. Worth noting this value anyway if you are anywhere slightly hilly, then when the winter warnings say snow (for example) above 200m, you will know if that is you, or the route to work/school etc.
So my Height above s.l. was 120m =
393ft (About x3.29 metres to Feet)
My thickness (off chart as above 21st Nov) was
1295 gpm
Mean sl Pressure
1016mb,
Example (for a differnt day) shown below on Netweather 7 day forecast, choose middle value it won't make much difference

Armed with your values you need the snow predictor chart

Line are drawn across from thickness and up from pressure, where they meet follow diagonal line down and across, until they intersect the vertical Height (in feet!) line, then carry on up the diagonal line to your percentage prob. of snow. 45 % for that day in Grampian
The template chart will be available, i'm just off to check where it will be found..... Bring on Friday 27th's wintry brief blast.

Saturday 16th update
We're now into the comfortable 5 day short term forecast zone. Still a cold plunge to look over for next week (even with some wobbles), and there are snow showers showing up on the forecast charts. There will always be differences between the various forecast models, Weds 20th being a source of several variations for next week.
However, in this flow with a major northerly component, there is cold Arctic air coming down over the relatively warmer waters around the UK. Sea surface temperatures are currently between 10-12C N-S. What you should begin to spot in the new week (on the satellite & radar images) will be showers being set off near the coasts. Look for blobs of white or radar echoes, rather than streaks of frontal cloud/prec.
This colder air will be warmed at the surface by the waters, that warmer air will then want to rise, the air column becomes unstable and overturns. Moisture is released by the rising air, you see towering Cu, even Cb (Cumulonimbus) forming. I'd often see these along the Moray Firth, off the north coast of Scotland. Inland, clear and cold, and the low sun catching the shower clouds going up just offshore.
You can follow the showers progress visually by using animate on the radar sequence, or on the Netweather Extra (subscription) charts use 700hpa winds to forecast their motion for yourself. North Wales looks like seeing some as the showers progress down the west coast of Scotland, nip through the N.Channel on Tues. After Weds. there could be a more NNE component and the showers may collide with the Borders or Northumberland coasts instead.
Thursday update
Looking at next week, snow risk charts:
http://www.netweather.tv/index.cgi?action=snow;sess=Move bar across to late monday into Tues 19th Weds 20th Nov. You can see lines of wintry showers moving there way down the country through Tuesday, as the snow level falls and falls down to Sea Level (SL) by the end of Tuesday across much of the UK. This means there is the possibility of wintry showers down to low levels, you'd still need an actual shower to come over your head, but for many southern parts the ground is still too warm for much settling.
Look at the winds as well, Tuesday shows NW winds, which fits in with the pattern of showers mainly over Wales, NW Egnland, N.Ireland and N+W Scotland. On Wednesday the winds become more northerly and that allows heavy showers to come straight down the North Sea into the Yorkshire coast. The further out the frame of the model, the less the detail, so that big snowy blob will be a collection of individual heavy showers. That little pulse however could be further north, or east, so may get Norfolk or miss eastern Britain and head for the Low Countries.
Have a look at the ensembles:
http://www.netweather.tv/index.cgi?action=ensviewer;sess=Choose maps SLP & H500
Looking at these postage stamp like ensembles gives a good reminder that one chart for next Weds is not 100% accurate. The ensemble output is made by very slightly altering one variable here, another there. Running the model again and again and then lining up the outputs. The group for next Tues/Weds all show the cold plunge down across the UK. That seems pretty set. If you try to look at the white lines of the (SL) pressure, there are lots of differences, that will be the fine detail of where the precipitation comes (who gets the snow showers) next week.
4th Dec

Radar picture from early afternoon showing air temps, blue rain showers and hints of green (sleet) and pink (snow) echoes across Highland. Worth checking tomorrow, as 100-500 thickness forecast shows 515DAM, currently just into 526 (14Z)
18th Dec

500DAM thickness fall during Thursday morning. Only showers being driven in from the WSW on brisk winds, so hit and miss for any precipitation. NW Scotland and W.Isles look likely for snow but wintry N.Ireland, Wales, NW England possible.
Worth watching the little feature which appears from the southwest during Thursday morning, potential for some wintry stuff from this in its progress eastwards.
2014
Jan 9th - With lots of media coverage of the US snowfalls and severe chill, thoughts are turning to snow once more for the UK.
Any concerns about the Polar Vortex see blog
http://www.netweather.tv/index.cgi?action=news;storyid=5606;sess=The US weather is not coming to the UK. What may bring some snow to the UK in the next 10days is colder air from the East. So from Siberia, eastern Europe, with hints of high pressure building to the east of the UK, stopping (blocking) the progess of all the Atlantic lows. The High could then allow colder air to flow over the North Sea. This air will then warm in its lowers levels (North Sea is still around 8C) and cause instablity and so snow showers. If the winds do turn NE'ly/ E'ly those showers will come towards northern and eastern Scotland, and NE/ eastern England. If the winds are strong enough, the showers could come further inland. This setup looks rather short lived (if it does come off and affect the UK), before we return to the milder, wet and windy Atlantic flow.
So again worth looking at the 1000-500 thickness charts, the PSL pressure with the winds, also Snow Risk recognising this is quite far out in the forecast sequence and showers are hit and miss on the actual day, never mind 7 days out. 50/50 being bandied about as a % of this blocking feature to develop next week, but it gives snow lovers some hope and something to watch over the next few days.
Image shows tricky setup of milder Atlantic air with more rain shoving against the colder possible High pressure to the east, mid next week. Thickness and prec/PSL