


Uncle_Barty
-
Posts
467 -
Joined
-
Last visited
Content Type
Forums
Blogs
Gallery
Events
Learn About Weather and Meteorology
Community guides
Posts posted by Uncle_Barty
-
-
Hello,
There used to be a rain radar archive on here - does it still exist?
THanks.
-
6 hours ago, cheese said:
I can’t remember many instances of fog in September tbh
I remember thick fog in the mornings during the September 1982 heatwave. Clear nights and no wind ripe conditions for radiation fog, to give it its proper name.
-
 3
3
-
 1
1
-
-
7 hours ago, Methuselah said:
Looking at what the models have been predicting these past few days, one cannot entirely rule out the possibility that September could come in warmer than both July and August.

That would take some doing here. August mean was 17.5c here, my Sept record going back to 1996 (set in 2021) is 17.2c. I don't know if we've ever had a CET warmer in Sept than the Aug that preceded it.
-
1
-
-
11 hours ago, Metwatch said:
Interesting! Howcome?
Temperature inversion leading to long distance reception of VHF signals. Radio amateurs make use of these condidtions to make longer distances on VHF - I once exceeded 1600km for one contact made on 144Mhz under anticyclonic conditions.
Same sort of scenario that led to TV stations broadcasting messages about co-channel reception and "do not adjust your TV set!"
Original post: https://community.netweather.tv/topic/99056-model-output-discussion-mid-summer-onwards/?do=findComment&comment=4914600 -
11 hours ago, Metwatch said:
Interesting! Howcome?
Temperature inversion leading to long distance reception of VHF signals. Radio amateurs make use of these condidtions to make longer distances on VHF - I once exceeded 1600km for one contact made on 144Mhz under anticyclonic conditions.
Same sort of scenario that led to TV stations broadcasting messages about co-channel reception and "do not adjust your TV set!"
-
3
-
4
-
-
I don't know about the potential heat, but the high T850s and a cooler undercut could lead to some pretty special radio conditions next week, for those who are so inclined....
-
1
-
-
26 minutes ago, MP-R said:
High pressure didn’t last beyond the first week of October in 2002. The rest of the autumn was then very wet, especially November.
Indeed, the monthly average pressure for Sept/Oct/Nov 2002 here was 1019.2 / 1010 / 1004
-
28 minutes ago, Dorsetbred said:
Neither yesterday or today have been bad down here. Whilst people complain about the bad weather every weekend for xxxxx, it is very much IMBY stuff.
Agreed... I was referring to country-wide, as I recognise we've done relatively ok down here.
-
1
-
-
4 minutes ago, johnholmes said:
Sunday 13 August with NOAA for Saturday evening and midnight ECMWF
Well it seems much as 24 hours ago. However looking at the ECMWF output starting on Sat 19 August and a rather different outlook seems likely. The flabby high is pushed east as a deepening upper low moves SE from near Greenland. This was actually shown 3 days ago on NOAA and is shown well last evening; (see the bulge in the contour into Iceland from the NE and then out SE towards the UK). The associated surface low is clearly shown on the ECMWF output for Saturday 19th. I have to confess I missed this development until messing about, initially, not taking any notice of the ECMWF output. So the, currently Met O predict of very warm/hot spell of weather is not going to happen it seems. Yet another weekend, will it be the 6th on the trot, with disturbed weather?
It remains to be seen what the NOAA 500 will look like this evening. If we follow the ECMWF then expect the surface feature to fill as a surface ridge pushes in from the Atlantic. The 850 mb temperatures are predicted to fall noticeably from the 19 th values to several degrees lower 2 days later and remaining at or below 10 C into mid week.
charts to follow, hopefully you will be able to enlarge the ECMWF charts.
I make it 8 - 1/8/15/22/29 July, 5/12 August is 7 so far, though the 1st wasnt that bad on the south coast.
-
5 hours ago, mushymanrob said:
as things stand, its on its own and these charts have been suggesting an improvement on several occassions this month, all of which has failed.
That is the problem - and as Chris A pointed out a few posts ago - we need these improvements to get to 5 days away before we can take them seriously. I'd go further and add .."with cross model support".
6 hours ago, Tamara said:Your response illustrates my point. The broken clock analogy applies, anything but, to attempted analysis that is based on best information available at a given time. It might be information you don't understand, and the weather makes mugs of better people than me for sure, but I guess for your ilk it makes it much easier to toss into a file named garbage. You win a broken clock as a prize for endearing insight.
To be referenced as vague is a large enough irony. Don't conflate personal lack of understanding with "vagueness" c/o apathy and cynicism related to perceived flaws in the science of weather analysis. Largely driven by parochial ignorance.
This isn't fun and how to spend a weekend. Off to attend to the peahens,chickens, cats and the goats.
Ciao e todos.
I am starting to understand some of the basics a little better - but it is disappointing to see posters who add the global picture, being dismissed by some in that manner. I'm not sure we will ever know why the ocean-atmospheric coupling in the Pacific did not happen as most expected, but it is very poor form to shoot the messengers here.
-
1
-
 1
1
-
-
16 hours ago, razorgrain said:
I may be mistaken, but didn't our last run of notably cold/snowy winter around 2009/2010 also coincide with a solar minimum and that volcanic eruption in Iceland spewing ash across Europe? Certainly different synoptics this time around.
Eruption was April 2010.
I would strongly question any real correlation between low solar activity and cold winters. I can expand on that, but not here.
-
29 minutes ago, Don said:
Ref El Nino, it depends on how strong it gets and also if it develops into a CP event ala 2009.
The lack of atmospheric coupling of the El nino might reduce its intensity?
-
1
-
-
1 hour ago, Alderc 2.0 said:
This I do agree with, wouldn’t be surprised to see a glorious September. Off course by then though it’s too late, suns lost its strength and sunsets are rapidly drawing in to just after 7pm by the end of the month.
it's a bit like scoring from a dodgy 95th minite penalty. When you're losing 6-0....
-
1
-
-
36 minutes ago, Neil Harris said:
Don't know if historical models exist. I'm reading a book about the Ashes in 1985 (which ran from June to early September) and there is just constant moaning about the weather in it.
Is this a similar pattern?August was dreadful that year, the wettest of the century in Scotland, IIRC. I don't think the pattern was dissimilar to what is being progged now. Summer as a whole was different to this year, poor June and a rather mixed July. I bet the Manchester summer index was pretty ropey that year.
-
3 hours ago, MattH said:
Morning.
One has to acknowledge the 'painful' progression that this summer has taken, since late June all linked to the fall in AAM, as well advertised and discussed for some time. A few weeks ago I provided a screenshot of a piece of work on the long-range outlook with the phrase "locked in for some time" within it; even I have been surprised and incorrect about how long this cyclonic pattern has persisted. While I still don't think this summer can be compared with the likes of 2012, 2007 et al, as yet, the broader evolution (yet again!) of the best weather arriving earlier in the summer, or late spring, and then the proverbial 'wheels coming off scenario', is playing out again this summer. We have seen this a handful of times say in the last 10 to 15 years. Is this perhaps becoming a more common occurrence due to global warming and all the unusual unknowns in play?, possible, but hard to tell - It is clear, however, that we are certainly in a period of heightened uncertainty and questions, more generally, than say 10, 20, 30 years ago, due to the way global warming is influencing the climate at an ever rapid rate.
AGW aside and the AAM and the Pacific developments have and are now evolving as long predicted, we can see that in both model and observed data...

However, there is still little evidence of the AAM patterns and anomalies that were present in May and June. Clearly, this current rise in AAM is not as significant as back in May, equally, the AAM is also rising from an unexpectedly low point too. There are some 'messy' solutions now within NWP showing up in the long-term, but still, no clear-cut signal for the Atlantic trough and downstream ridge pattern before the opening week of August has passed, so that's another week gone.
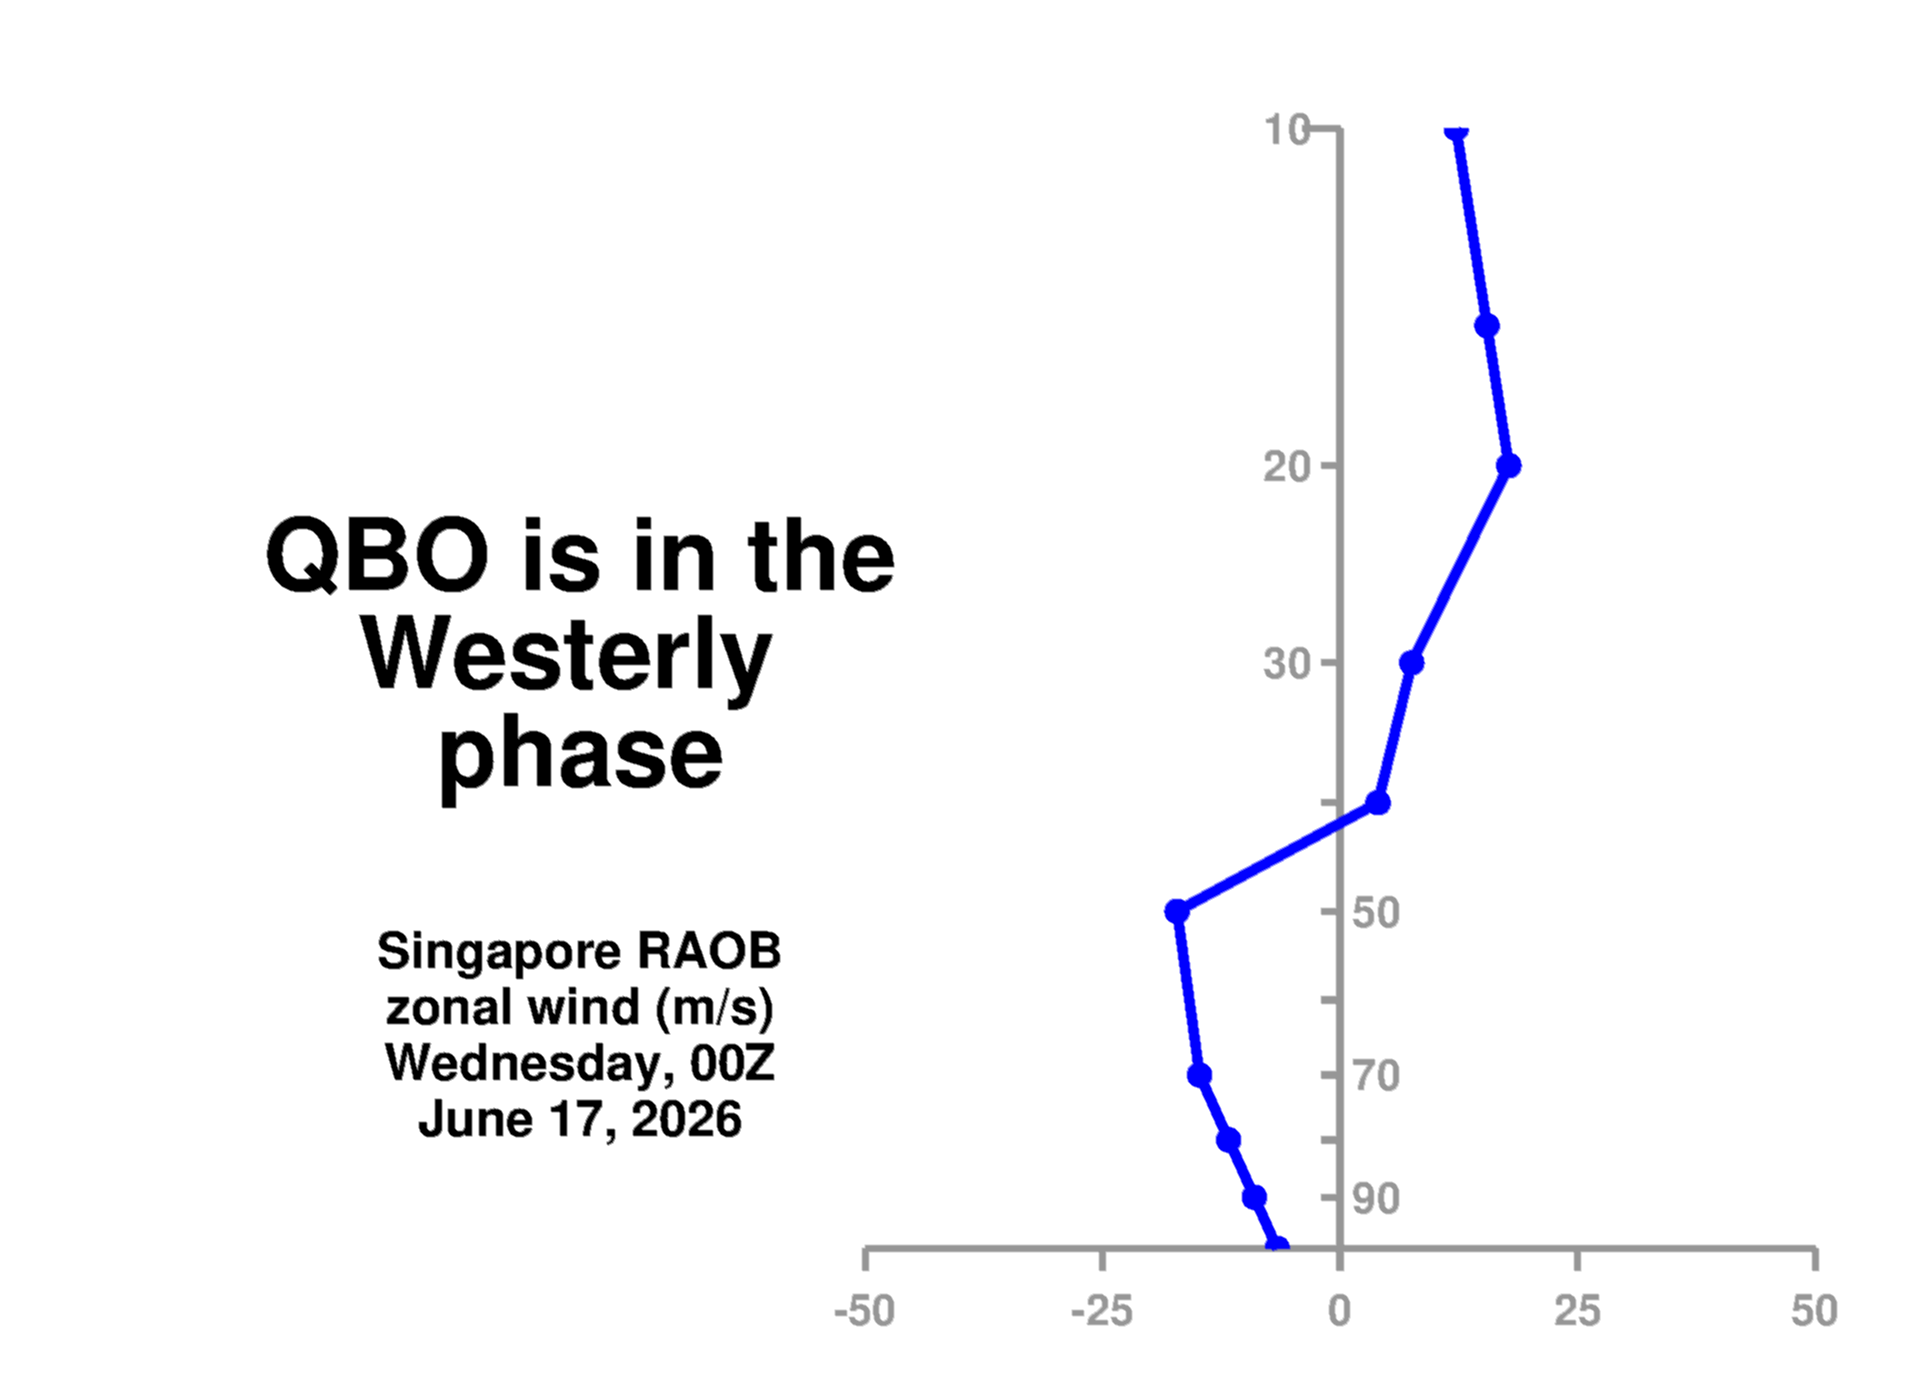
While I can be far from certain, when working over the weekend I was looking at the QBO and wondering whether the influence of this, as some have picked up on in here, could well be a player this summer, more so than was envisaged and/or expected. As is the case during the winter, in a changing QBO phase the lower levels of the stratosphere can be 'washed out', not a particularly scientific phrase, but it does highlight the situation well. Last summer, it was generally the opposite.
We are now well within a strong East Descending phase, the E'ly winds are now down to 30hPa (all very interesting for the winter!), beneath this and the W'lies are still in play - Is there some scope to suggest that this transitional phase of the QBO has arrived at the wrong time, to aid in juicing up the W'lies and the PFJ as the summer has ticked by? - I suggest it could well be. Since May and June, the QBO has continued to become more E'ly in the upper levels, flushing down the more W'ly anomalies, has this reinforced a more active jet stream pattern, especially when coupled with a complete breakdown in the +ve AAM pattern that dominated the late spring and early summer.
It's a piece of the jigsaw puzzle that is open for discussion, but while there has been an underestimation of how far AAM has fallen and, how, Tamara mentioned a few days ago, the atmospheric pattern, in particular, has resembled a more Nina regime, I feel there may well be more at play than just the GSDM/AAM this summer now.
I still think this rise in AAM will help to at least alleviate the pattern that has dominated the last 4-5 weeks, but will it bring us a solid 2-week spell of 'high summer' weather through August, I'm beginning to think not, especially seeing that it is likely that AAM will take something of a fall again through the second half of August. The additional complication through August as well will be remnant tropical features, as we all know sometimes these can help to bring some summer weather, but also reinforce a more cyclonic pattern too, that, however, is all for the short-term.
For now, a case of 'more of the same' as the summer increasingly quickly rattles on...
Cheers, Matt.
Quick question with the QBO chart - blue= Easterly, brown = westerly? or the other way round? Thanks.
-
8 hours ago, Addicks Fan 1981 said:
Was a bit disappointed with the ECM 12Z ensemble mean as its still got a trough parked over us, that being said it does lower heights to Greenland as well.
I usually pay very little attention to the mean - the clusters are a lot more important.
you could, say, have one cluster with a high to the north, low to the south, and another with the opposite. The mean would likely show a nondescript pattern which would reflect neither cluster.
-
1 hour ago, Djdazzle said:
Many of the best summers have two great months and one more average one. I think having a terrible month like this will tarnish this summer, regardless of what August produces.
It's the repeated weekend lows and the resulting ruining or mass cancellation of outdoor events that will taint this month most. It looks like we will have another low this weekend - 4th one in a row.
-
1
-
-
1 minute ago, northwestsnow said:
We don't all live in Basingstoke.
But you make a valid point, people in the south might wonder what the fuss is about ..
In the upcoming scenario it can be 22 and sunny in the south and 16 with grey skies and drizzle in Manchester..
This.
Here in Bournemouth, it's probably been no worse than "changeable" with just below average temps, albeit with the last two days being pretty much a writeoff for any meaningful outdoor summer activities.
Looking at the models, that looks likely to continue for the foreseeable.
It's clearly been far worse up north, as is often the case in these setups.
-
2
-
-
22 minutes ago, Tamara said:
My last reiteration on this as I accept that no amount of rationale is going to be worthwhile when disillusion with the weather in the UK overrides any reasoning behind it.
There is no "theory". And there is certainly no "fad". That is, frankly, unwarranted trivialisation. These atmospheric drivers in the tropics and extra tropics are steeped in empirical science of the atmosphere & the physics of the turning force of the jet stream through angular momentum processes. All put together into a diagnostic framework.
There is nothing wrong with the science,. What can go wrong is natural human error in decoding the complexities from time to time - but that doesn't make the teleconnection tools related to the science themselves wrong or of little use. As much as it doesn't make the 500mb charts wrong at any given time, irrespective of the fact that they may change in their outlook subsequently according to the diagnostic that drives then and there can equally be human error with these. The point is that they attempt to model the diagnostic processes that are in never ending flux - and such flux constantly evolves the outlook. The 500mb charts are the best overview of numerical overview interpretation. There is no disputing that. However, as stated, these evolve & change as much as NWP evolves & changes its outlook according to its interpretation of the diagnostics that drive them.
The reasoning for the changes this July have been stated umpteen times. it is not the teleconnections that are to blame for departure from expectations (in the UK). And neither is the present situation to do with any butterfly or random effects. It is a natural cyclical ebb in the state of the atmosphere that has produced a pronounced disconnect much greater than was anticipated. Nothing more, nothing less.
Finally, and with that in mind, ownership has to be taken for the fact that the focus of the downturn happens to be in the vicinity of the focus of a UK weather forum. Better to accept the reality of that disappointment, and own the disappointment - than blame the science, or the tools used based on the science.
Whatever the weather, hope as many of you can enjoy the remainder of the summer.
I guess the lesson to work out here is *why* there is this disconnect between the oceanic base state and the atmosphere, whether there were any signs of this beforehand, and if/how this can be foreseen in future.
In any case, I've always regarded the various teleconnecions (as excellently set out by Tamara and others... when I get the chance, I still need to get a proper handle on them.. been looking on Youtube for some "dummies" guide on how to read the various charts,) as a guide as to what may be down the line, and certainly not as a firm prediction.
I still remember 2011, when after a poor June, general hope from the various indicators was for a much better July based on seasonal wavelength changes... then the goalposts were moved and we ended up with a crap July anyway.
-
1
-
-
- Popular Post
33 minutes ago, Tamara said:.
As such, and with so much else of more importance to do in the real world, it is, frankly, quite reasonable to wonder if there is any point in taking spare time out to bother.
It is exactly the content from the likes of yourself and others, that I come on here to read. Your posts are massively appreciated here.
I am usually one of the 'silent majority'.
There are a number of posters that emotionally react to each twist and turn in the MO; I skim past those.
In the light of the very useful posts looking at global patterns, I would pay very little attention to the NWP past about 7-8 days until they begin to show a consistent pattern, and with a reasonable amount of inter-model agreement.
-
18
-
40 minutes ago, Tamara said:
Based on a record breaking June (in UK) and the first 10 days of July actually perfectly respectable against long term temperature averages, there is a lot of excess reactivity instead of proactivity to be waded & skipped through. Considering calling time on seasonal LTF's is just as absurd (based on a good match overall so far) and extrapolating weeks ahead at a time based on face value numerical model interpretations. Signals lead models, not the other way around - and models do always read signals impeccably particularly in periods of excess of 10 to 15 days ahead.
The facts are repeatedly laid out as to how & why the pattern is the way it is and what will change it (and will change it) Latest GSDM updated consolidated data confirms a full volte face to a Nina-esque type of forcing, so the synoptic response should not be a surprise with such a collapse of angular momentum,
As part of the broken record, one context of this is a natural lull in the mini ENSO cycle ahead of the next upswing (and associated reconfiguring of the pattern which for NW Europe means a return to more summer like weather) It just so happens that this cyclical downturn has coincided with (part) of the peak of summer. However, another context is the record breaking June that came before it & the fact that this lull phase is not long term sustainable.
Exactly... and I've seen this happen several times before (and I now understand better why that is) - when a pattern change comes "apparently" Out of the Blue in the model output, when before we'd all be Standin' in the Rain, then Mr Blue Sky arrives like a Wild West Hero.
And it won't be a surprise when the Sweet Talkin' Woman above kept telling us to keep the faith. Meanwhile, the Big Wheels of model output keep on turning, and promise us some Summer and Lightning further down the line.
This post will either puzzle you , or get you saying "that is a brilliant album...."
-
3
-
1
-
-
17 minutes ago, Alderc said:
Another extremely disappointing 06Z from GFS which again is heavily supported by a very strong signal from the ensembles of low pressure never being too far away from the uk. Every time pressure appears to build momentum always appears to favour a low pressure dropping down from the Icelandic region.
While certainly not as bad as 2012 it’s becoming clearly 2023 will likely be the worst July since then and make a mockery of the LRF’s probably the biggest fail since the infamous bbq summer forecast.
July mean here so far is 17.6°c - 2020 and 2015 were both lower (17.2 and 17.1 respectively).
2012 was a pitiful 16.2°c, dragged down by some very poor temps in the first 10 days or so. On only 4 days of that month (around the 23rd) did each day's mean exceed the July average mean temp here (17.9) since 2000.
2 hours ago, Mike Poole said:Yes, I think the signal from the EPS (at the moment) is for higher pressure to influence the UK, but to remain resolutely to our west, and not push across the UK.
Yesterday’s 12z clusters showed this well in the T264+ timeframe:
A common theme here is the Atlantic ridge regime (purple border) - (I know, I whinge when there is only one cluster, and when there are more of them, I comment on the common theme!). Still there this morning, although less notable. But what is notable is still the absence of the red (Scandi block) regime, which has been the expected ultimate ‘direction of travel’, both from a background signals and longer range models point of view.
Speaking of regimes, the recent ECM 46 take has been as follows:
Note the increasing probability of the purple Atlantic ridge regime (highlighted on the most recent chart) for week 2. But also note the red later on - still very much the ‘jam tomorrow’ theme of this July!
Whats the colour decode for the other ones, please?
-
1
-
-
1 hour ago, Djdazzle said:
Well it would be a seismic event if July was cooler than June. So rarely happens and I think even with a poor July the CET will end up higher than June.
I don't know if this happened in 1988 - July was relentlessly cool and cyclonic after a reasonable June. We've not had a colder July since.
In my own records back to 1996, only in the pitiful summer of 2007 were June and July even equal (both 16.6c). About to break my June record by more than a whole °C (18.7c, will probably drop a bit.)
I don't know what an effect the anomalously warm seas in the Atlantic is having on skewing model output, but there must be a chance that they are making them less reliable in the meduim term, at least.
-
8 hours ago, ANYWEATHER said:
What do you mean by New age hot summers?
Must be the summer equivilant of The mo dern winter
GFS looks unsettled again this m orning, seemingly having the same low parked north of, or over the UK from next weekend for days on end.
-
1
-


Netweather Rain Radar archive
in Help, support and feedback
Posted
Thank you, Paul