


Admiral_Bobski
-
Posts
1,787 -
Joined
-
Last visited
-
Days Won
1
Content Type
Forums
Blogs
Gallery
Events
Learn About Weather and Meteorology
Community guides
Posts posted by Admiral_Bobski
-
-
Look at it this way - some energy from the Sun has gone into the melting of the ice and now, in your words, that energy is "free". It has taken some time for the ice to melt, so the incident energy has come into the system, performed a "task" (the task of melting sea ice) and then been "freed up". That means that energy has been trapped in the system, which means that there has been a lag between the energy coming in and its being freed up into the atmospheric system. Is this not just one of many ways in which there is a lag in the climate system?
It's been a long time since I did science at school but hasn't that energy been used to melt the ice to water and therefore it cannot be "freed up" into the atmospheric system unless the water refreezes.
Absolutely right, Pete. The point being that there is energy "stored" in the liquid water that can be released further down the line when the water refreezes. I apologise for not making that clear.

I'd imagine (and I do a lot of that!) that the worry with AGW was that we did not fully understand the complexities of the initial climate inertia and so 'tweaked' models to get agreement with observations for the hind-casts.
Were this indeed the case then the projection of those models will fall woefully short of the reality we find ourselves in with this 'extra energy' appearing in amounts that the models did not account for. Impacts would , of course, snowball thereafter.
When you look at sea levels the last time global GHG's were at a similar level you get to see just what type of 'warming' event would be needed to see the situation 'normalised'? Sadly 'normalising' sea levels just reanimates another swathe of hibernating carbon cycle and so around we go again.
I'm sorry - I don't quite get what you're saying...?
-
It's nothing to do with independence of variables, it's the fact that you're using a proxy for long-term temperature change to try and predict long-term temperature change - explaining one variable in terms of itself. A good fit isn't surprising. It's like trying to model the changing height of the British population over time by using trouser length as an input. Sure it agrees well, but it's not going to tell you anything about what happens in 50 years' time.
I think this is an important point you've brought up here. The LI is not really a predictive theory - it operates on the basis that the inputs at any given moment in time carry over to the next moment in time. It is an explanatory model: it explains why temperatures behave the way they do, retrospectively. The only way to use it for prediction would be to know for a fact what the Sun is going to do in the future, what ENSO is going to do, what the planet's albedo will be, what volcanoes are going to erupt. SInce these inputs are not easily predictable, the output cannot be predictive as such.
So the LI shows that hysteresis can explain temperature change. Prediction is irrelevant. The difference between the LI and your analogy of leg-length is that in your proposal, all we are doing is plotting raw data and then drawing a conclusion, like the old bar graphs we did in school. With the LI, the data are undergoing a process which produces results which are then plotted - the graph is not a plot of raw data, it is data that have undergone a function. The raw data don't explain anything.
Does the LI's predictive limitations invalidate it as a model of climate? Not at all. This would only be the case if climate was inherently predictable, and we know for a fact that it is not. This being the case, AGW theory - a theory that purports to be able to predict future climate - seems even less credible to me than it did before.
-
I'd just like to chip in here and say, up front, that I have very little desire to pursue the LI any further. I immersed myself in it 3 years ago, researched my butt off, read papers, gathered datasets and so on and so forth - BW did even more than I did, a fact for which I am very grateful and also extremely sorry about - but I really no longer have the enthusiasm for the subject.
To be frank, I think we struck gold with the idea and I was extremely disappointed and upset that very few others shared my enthusiasm (there are many people who say, "oh, I wish, I wish, I wish AGW weren't true!" but actually have no desire to explore alternative hypotheses).
I really don't want to be dragged down into the mire, and I would be devastated if my recent rekindling of the subject were to drag BW back into it out of a sense of duty.
On the other hand, and as I said in a previous post, I am happy to restate some of the thoughts we had at the time, or try to elaborate upon those thoughts. I saw a post in which the LI was sorely misrepresented and I didn't want it going down in Netweather history as some crackpot idea that was complete nonsense, on the basis of a few ill-informed posts by other members.
My only regret is that we didn't go so far as to run the model into the future by 30 years, just so that we could perform a comparison every 10 years - that would have been interesting. The prediction up to 2015 is a curiosity that has held up pretty well for 3 years, but the cooling it predicts is on the basis of assumptions (the presumed datasets) that no longer hold true. I don't feel the idea can be rubbished if temperatures do not plummet in the next 2 years (though, on the other hand, if temperatures do plummet then that would be remarkably interesting).
So, in conclusion, ask me questions and I'll do my best to answer them. If BW wants to get back into the thick of it and start producing models again then I'll be happy to get back into it, but if he has no desire for it then that's absolutely fine by me. I don't want to drag others in after me, especially after the grief that we got last time.
-
As I recall, adding ENSO really snapped the LI output to match observed trends to a greater precision - I'd be reluctant to drop it on the basis that, although it could be considered to be a generic lag-causing phenomenon and hence already included in the "size of the hole", it is a greater modulator of atmospheric heat than any one other thing. In a way it almost could be considered a source of heat at certain times, while a sink of heat at others.
As for the sea ice extent/albedo issue, we accepted at the time that it was not a perfect proxy, but decided that, in the absence of anything better, it should show a general trend of decreasing albedo. I am happy to disregard the albedo data until it can be replaced with a better dataset. Bear in mind, songster, that this is currently a fairly low-res chart, using only 1 datapoint per year - averaging the northern and southern hemisphere summer-only data would be a better way of getting a yearly average, I guess, but that was more work than we were able to take on at the time.
-
Just a few question, if it's the solar input adding energy to the Earth system and warming the oceans, thus driving things like ENSO, then isn't heat release by ENSO just a way of the solar energy moving through the system? So in this sense, El Nino isn't adding any energy to the system?
What different forcings have been added so far? I'm aware of ENSO, sea ice, volcanic eruptions and solar activity. Is there anything else? Is the sea ice just for the Arctic?
Cheers
That's correct: ENSO isn't a source of heat per se. However, the timings of the ENSO events are relevant in that they modulate the basic hysteresis effect (or, to put it another way, they refine the output to give a closer match to reality). As I said the other day, the timing of the heat in and heat out of ENSO can make subtle differences depending upon the timing of solar events.
The only factors we included were, as you say, Solar Input (as proxied by sunspot data), ENSO, Volcanic activity and Albedo (as proxied by sea ice). The sea ice data was total global data, as I recall, and not just Arctic sea ice.
-
Congrats on the promotion Rob, does it come with a chic new hat?
Sadly, no - but I did get a new haircut
If anything L.I. shows us a mechanism that can ape early AGW impacts but , now climate inertia is increasingly overcome, will the L.I. theory still be up to the job?
Most of our current warming has occured since the 1980's and we can see the 'natural' warm drivers that helped in this process. Now we are in a suite of colder drivers we continue to see high temps but also major physical changes that are driven by exposure to a continuous warm driver (Arctic sea ice loss/permafrost melt to ever greater depths/ice sheet mass loss) even though logic begs that we should be cooling from the high's of the 80's?
Logic begs that we should be cooling? The LI doesn't show cooling, and the LI is a mathematical formula - it doesn't get much more Logical than mathematical formulae.
Of course the loss of ice leads to 'new' energy forcings in the form of albedo flip and also the energy freed up by the loss of ice to melt.Basically we have the continuous AGW driver (slowly growing year on year?) but now, suddenly, other energy sources within the climate model that did not exist prior to the late 90's (and also growing year on year).
I do not remember the L.I. mapping a period where it's forcing brought about the introduction of an energy budget that altered it's deployment and also had new sources of energy that could be introduced into the model when certain parameters where reached?
We don't have other energy sources as such, merely a reallocation of the distribution of energy that came from the Sun, which is precisely what the LI is all about. Look at it this way - some energy from the Sun has gone into the melting of the ice and now, in your words, that energy is "free". It has taken some time for the ice to melt, so the incident energy has come into the system, performed a "task" (the task of melting sea ice) and then been "freed up". That means that energy has been trapped in the system, which means that there has been a lag between the energy coming in and its being freed up into the atmospheric system. Is this not just one of many ways in which there is a lag in the climate system?
This being the case, have we not just proven a central tenet of the LI: that the climate system exhibits hysteresis?
(Also, changes in albedo are factored into the LI, so that "forcing" is accommodated by the hypothesis.)
-
That sounds about right, BW
(Have to resist the urge to call you VP!)As a little tidbit of background info, in the LI, greenhouse gases are part of what determines the size of the hole. According to AGW theory, as GHG concentrations increase, the "hole" gets smaller, thereby decreasing the amount of heat that can escape into space.
What got us so excited about the LI (or got me excited, at least) was that we could get a seemingly good match with actual observed real-world temperature without changing the size of the hole!
If the LI were to verify as a legitimate model then it would suggest that changing GHG concentrations in the atmosphere has a negligible effect on temperatures (at least in the concentrations we are talking about).
Now, obviously we met a lot of resistance to this idea, on the basis that we all "know" that GHGs have an effect. But I have always argued that, although GHGs may have a straightforward effect per se, once those GHGs are in an ever-changing, dynamic system like the real world, replete with sinks, checks and balances, the situation becomes less clear-cut.
Discuss...
PS - Changed my name - thought I deserved a promotion!
-
Ah, but you can also have the same lag with cooling, which would eventually even things out.
Yes indeed, you can have the same lag with cooling, but it would not necessarily even things out, depending on the timing and duration of such events - such is the nature of the time lag. The lag issue complicates the issue beyond a simple net-effect cancellation.
-
I think the main issue with trying to extend any ENSO like feature back more than a few centuries, is that as an oscillation, overtime it's effect is equal to pretty much zero. It's only on shorter time scales that ENSO's impact on global temperatures can be seen.
While I agree that, in and of itself, an ocean oscillation has a presumed net effect of zero, the issue becomes more complicated when introducing the concept of lag.
If heat is stored during a period of higher solar activity, retained through a period of low solar activity, and then released during another period of high solar activity then it affects the outcome differently from the way it would if the heat was released during the earlier (or a later) period.
Where the heat actually is at any given moment in time potentially makes a difference.
Regardless of the particular arrangement of continents, the ocean must always have had some kind of rolling heat capacitance, due to its gravitationally-induced motion - the way this motion would affect retention and emission of heat may be different, further complicating matters, but there would have been an effect.
Perhaps of more importance on these timescales is the albedo effect - long periods occurred when there were no icecaps, while at other times there were periods of enormous ice extent. How much of an effect this may have had on LI-style heat retention and lag effects I am not sure, since I lack the data.
-
How can you even think ENSO could have any relevance to palaeoclimate? Depending on the configurations of the continents, there wasn't even a SO, let alone an EN.
Begging your pardon, sir, that I didn't say "Oceanic Overturning/Oscillating/Currents Etc.," for there must have been some movement of the planet's oceans even 600 million years ago (we still had a Moon back then). We used the facility that ENSO has of swallowing up and spitting out heat in cycles (El Nino, La Nina) as a moderating factor in our refinement of the LI output. Now, even if there was no El Nino or La Nina a hundred million years ago, due to the configuration of continents, this facility must have existed in some format or other because - and here's the shocker - the oceans move! (gasp!)
-
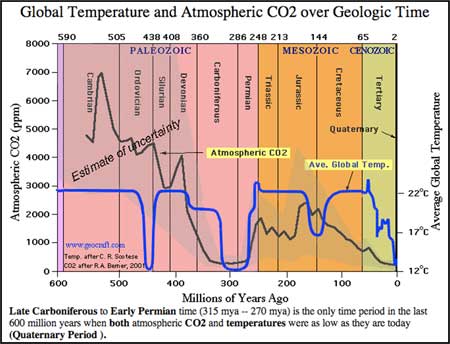
Perhaps he could clarify - we had discussed, way back in the early days of the LI, how the Earth has varied between a minimum of about 10C and a maximum of about 25C over the past 600 million years. Obviously the Vostok core doesn't even cover one half of one million years, so those extremes are only variations around the "current" average temperature of about 12C. Although those variations are obviously of interest, of more interest still (to me, at least) is that there seems to have been, for over half a billion years, some kind of cap on Earth's possible temperature extremes.
I suppose we could go back even further still and discuss the faint young sun paradox!?A discussion of the faint young sun paradox would be interesting....it might be nice, one day, to find some proxies for the LI's various inputs going back many hundreds of millions of years and see what happens, but I don;t know if there's any way of extrapolating ENSO information back that far, or even reliable sunspot data for that matter. Please bear in mind that I haven't really thought much about the LI in about 3 years now and I'm a bit out of practice!
-
The upper and lower temperature limit only applies to the geologically recent past though, doesn't it?
Depends on what you mean by "Geologically Recent"!
Is 600 million years long enough?
-
Actually, the "impacts of AGW" were not portrayed at all - that was kind of the point of the whole exercise - and not for lack of data but rather as an exploration of the possibilities of there being no significant AGW effect.
I am very wary of this whole "positive feedbacks" issue, which is kind of why I keep on saying "Time Will Tell", but I would like to call you out on your use of the word "dictate" and offer the use, instead, of the word "suggest".
-
As I recall LI had a near constant input but the 'tap' filling the bucket is now running at an ever increasing rate whilst the hole in the base is narrowing due to CO2 sink failures/ice loss/Albedo flip.
As a point of order, the "tap" filling the bucket was the Sun, which is not a near-constant input - it varies over the sunspot cycle, and sunspot cycles vary from cycle to cycle. The whole point of the LI was that we had a large peak in sunspot activity around the middle of last century, and we considered what might happen if this increased solar activity was equivalent to a sudden increase in the "tap's" input. Since the 1950s we have had sustained high sunspot cycles, right up until this current one, which is more in keeping with cycles prior to the 1950s.
Also, the LI made no mention of CO2. CO2 was not considered to be a cause of a "narrowing hole" - my initial desire was to see what would happen if we didn't take CO2 into account...and we got a pretty nice comparison between the LI and real world temperatures. The assumption was that maybe CO2's effects are not as large as has been presumed, due, perhaps, to some balancing or mitigating natural effect.
As a final point, I would like to just reiterate that the LI predicted temperatures to remain pretty much level over the next several years (barring natural year-to-year variations) before starting to drop off, if solar activity does not pick back up! So, as is now something akin to my catchphrase, I guess we'll just have to wait and see.
-
Then there is no point in discussing this further. You are against the idea in principle, you fail to grasp any point I am making. Your assertion that throwing in any random information would correlate with temperatures is complete nonsense. The fact that you can't grasp how raw data can be usable is slightly worrying. I've demonstrated a lack of knowledge of how climate research works? Really? So, does climate research work by writing a scientific paper and then drawing conclusions that aren't rational or legitimate so that it supports AGW? If so then all the pieces start to fall into place.
-
I never said the lack of a plausible physical mechanism invalidates it, just that I'd have doubts without there being one.
If you doubt it then you doubt its validity, hence the lack of a plausible physical mechanism would render it invalid top you.
Hysteresis is certainly observable on many different scale, I have no arguments whatsoever with that. Where my problem would lie, is with the mechanism for the storage and release of heat from solar variability on multi-decadal scales.I don't understand this. You accept that there is hysteresis, but that it can only occur on short timescales? That makes absolutely zero sense to me.
I would disagree with you that the CO2 temperature relationship is a purely statistical one. CO2 (and others) are known greenhouse gasses. They are part of the Earths hysteresis system, without them, it would be quite a deal colder than it is now! When we see that the surface of the Earth is warming while the stratosphere has been cooling, that is another sign that CO2 is at play.I never claimed that the CO2-temperature relationship was purely statistical. I used the terms "primarily" and "largely" statistical, but never "purely". A greenhouse gas in a pure laboratory environment might be proven to act in a certain way, but when in the real world, with a huge and complicated set of checks and balances and other mechanisms in play, is the effect of the greenhouse gas necessarily going to be identical to the laboratory?
If you want to look at where the purely statistical relationship lies, it's much more with solar activity. Despite that, it's been an area that has generated large amounts of research, past and on going, it has not been ignored.I know there's been lots of research. I've even read some of it. In fact, some of that research is what I referred to in an earlier post when I said that some conclusions do not follow on logically from the preceding paper. It seems as though the scientific community is too scared to suggest that CO2-driven global warming might not be wholly accurate. I'll probably be pilloried for that statement, but it's true.
Anywho, how do you mean you didn't jig the equation? Surely ye based the different forcings such as solar, ENSO etc., on figures that would best fit the observed temperature trend? You can't just put the raw index figure into an equation like that, what adjustments and weighting did ye assign to the different factors and what was yer reasoning behind them?You would be surprised how little was done to the raw figures. No real adjustments were made, to the best of my knowledge (VP actually ran the data, though I did do some preliminary stuff with the basic equation which was literally just plugging numbers in, no adjustment necessary). The closest we came to "weighting" data was, I believe, attributing numbers to the volcanic data on the basis of the VEI number - to clarify, we took every magnitude 4 eruption as a number 4, every magnitude 3 as a number 3 and so on, which did mean that we were effectively using ballpark figures. Even the albedo was proxied by using ice coverage data and pretty much just plugging it in to the equation.
Like I said earlier, I wasn't involved the this area much during the LI phase, but while it does sound interesting, I'd need a lot more info to take it seriously as what you've said so far hasn't left me filled with confidence for it!Perhaps it's time to re-open the LI thread? If it's still about?
So you have no confidence in it? What about the visible similarity of the output of the LI with observed temperature data? Are you suggesting that we falsified the output? That we tweaked it to make it fit? You're welcome to take a look at the LI thread - you'll find that there may be a few bitter comments from various contributors (including me), but if you can overlook that then you might get something out of it.
-
I confess that I haven't read the papers to which he linked, and nor have I yet taken the time to read the AR5 - I read through the links that I posted and was immediately struck by the similarities between what he was suggesting and the LI hypothesis that VP and I conceived over 2 years ago, and that seemed like a pertinent reason to post up the links.
Further investigation into Rawls shows that he is a staunch Republican who is very anti-AGW, which begs the question of why he was involved in the review of the AR5 in the first place. I'm not sure I agree with many of his views, despite me tending towards conservatism and anti-AGW sentiment myself! But, just because someone is an extremist of one sort or another does not necessarily invalidate their opinions. As I say, I was struck by the similarities between his arguments and the LI.
With regards the LI, I reject the assertion that the lack of a plausible physical mechanism invalidates the hypothesis. Furthermore, we know that the atmosphere exhibits hysteresis - from a very basic and obvious standpoint, the atmosphere prevents Earth's temperature from plummeting to -100C or more at night - it is clearly capable of retaining heat! When we discussed the LI I posited some possible mechanisms, though I think some of it was more confusing (and perhaps nonsensical) than it needed to be. The bottom line is that the atmosphere "leaks" heat at a variable rate, determined by the amount of heat it receives, as specified by the Stefan-Boltzmann law.
Regardless, from a purely statistical standpoint, the correlation between solar activity (as proxied by sunspot activity) and global temperatures is uncanny, if one assumes that the Earth exhibits hysteresis (which, as I say, it clearly does). The absence of a known mechanism does not negate the fact that this correlation exists. The correlation alone is enough to warrant further investigation - after all, AGW theory is largely a statistical analysis, and is based primarily on the fact that temperatures correlate roughly with CO2 levels (though, ironically, this correlation is to a far smaller degree than the sunspot-proxy-with-hysteresis correlation).
And yet nobody seems to be interested in pursuing this correlation, while the lesser correlation has been investigated to the nth degree, which I find frustrating. I also find it frustrating that so many people are not even interested in this correlation - I was absolutely blown away when VP posted the first graph. I had postulated this idea that maybe the increased solar activity was above and beyond what the Earth could "cope" with, that maybe there is some kind of lag in Earth's ability to process the incoming and outgoing thermal radiation, and it was because of this increase that temperatures were on the rise, rather than because of an increase in Earth's capacity to retain it via CO2. VP suggested this concept of hysteresis to me (which was something I was not overly familiar with) and told me about the Leaky Integrator. Using this basic equation he took the sunspot activity as a proxy and processed it, and out popped this uncanny graph. It wasn't perfect, but it was interesting enough to explore further.
As a result, we played around with other factors that looked like they might be relevant - volcanic activity (which has a known cooling effect), ENSO (which alters the amount of heat in the atmosphere via the oceans), and albedo (which affects the amount of insolation reflected back into space). Interestingly - and excitingly, to me - every additional factor we incorporated into the equation refined the graph, bringing it closer and closer to the observed temperature record.
We didn't jig the equation. We didn't tweak any data. We started with the basic Leaky Integrator equation and we took real-world figures from respectable sources (records of major volcanic eruptions came from, I think, USGS; ENSO data came from NOAA; for albedo we used ice coverage as a proxy, also taken, if memory serves, from NOAA). VP would be able to give you a better idea of what went into the equation - there were a couple of assumptions, but these assumptions manifested themselves as constants, as I recall.
Anyway, it seems implausible to me that this hypothesis, which is very simple and requires the minimum of input data, can be complete nonsense. The correlation alone is surely enough to pique the curiosity of the scientifically-inclined? How can such a simple premise, with such limited data, produce such an astonishingly similar result to our measured temperature record?
=)
-
So in other words they are disregarding any chance that the sun has any significant effect because the only mechanism they will countenance is this GCR-cloud link?
And so, because the GCR-cloud link is apparently tenuous....this means that the sun has no effect on climate...?
And that's not a straw man?
okay......
But I've had this debate and this discussion before, when the AR4 was released, and I'm not going to start it all over again. It is completely pointless. I was merely interested in Rawls' comments on the two links I posted because they were so reminiscent of the Leaky Integrator theory ("hypothesis" would be perhaps more accurate) that VP and I worked on a while back.
Basically, I'm pretty convinced by the Leaky Integrator, which puts the lion's share of the "blame" for 20th Century warming at the Sun's feet - which, to me, makes a great deal of sense, for all the reasons I gave back when VP and I were working on it. We got shot down by a bunch of people who weren't interested in thinking about alternative hypotheses because "CO2 must be responsible". How could two people without "Climate Science" credentials possibly claim to have found a valid alternative to the hallowed IPCC?
=)
-
Ok, after a quick read of the section causing the blogosphere commotion... it would appear to be another case of taking something out of context and twisting it beyond recognition.
The conclusion is erroneous - it's a typical straw man. To paraphrase, "There is evidence the Sun is a bigger player than has been accepted, but TSI alone doesn't account for it. Perhaps GCRs are linked....yadda yadda yadda...but there's no evidence that GCRs have anything to do with global warming."
This leads to the conclusion that the Sun is not responsible, but the train of logic is incomprehensible (you might say "irrational").
-
I'm having a read of Rawl's explanation , but when it starts off like this
I'm not going to expect much in the way of rational thought! Perhaps I'll be proven wrong...
Just because it's bitter doesn't mean it's not rational!
And, Interitus, the wording of the paper's conclusion might be neither here nor there - I have read plenty of papers whose conclusions don't seem to derive from the preceding work!
-
So, James Delingpole (another Heartland Institute buddy, who could have guessed!?) is back repeating "its the sun wot did it"?
The very line
"The forcing from changes in total solar irradiance alone does not seem to account for these observations,"
Says the opposite of what wuwt and the telegraph are stating, and claims something like GCRs are necessary for TSI to have the claimed effect.
Anyway...
"TSI [total solar irradiance] and volcanic aerosols demonstrate a near-zero (–0.04 W m–2) change in the natural forcing compared to the anthropogenic AF increase of ~1.0 ± 0.3 W m–2"
Might be worth reading about the IPCC AR5 leak straight from the horse's mouth:
http://www.stopgreensuicide.com/ and http://wattsupwiththat.com/2012/02/22/omitted-variable-fraud-vast-evidence-for-solar-climate-driver-rates-one-oblique-sentence-in-ar5/
There's something strangely familiar about what Rawls says (cough-Leaky Integrator-cough!)
=)
-
And I'd still have to disagree with you GW...!
Still, I shan't argue with you because, well, we've been through it all before. Bottom line: I think our current understanding of climate drivers is wrong. The fact that something as compelling as the LI is so easily swept aside in favour of the pre-assumed "concensus" is, I feel, rather disturbing.
Anyway, I didn't come here to argue. As ever, time will tell...
=)
-
 2
2
-
-
I read recently that something weird has happened on the Sun - solar maximum appears to have peaked and passed in the Sun's northern hemisphere, but activity is still ongoing in the southern hemisphere.
http://www.newscientist.com/article/mg21528843.700-solar-maximum-oh-you-just-missed-it.html
I have no idea what that means for the cycle as a whole, but it is interesting nonetheless. Of particular interest is this paragraph:
Such a large asymmetry between hemispheres could be a sign of big changes ahead, says Steven Tobias, a mathematician at the University of Leeds, UK, who models what drives the sun's magnetic field. According to his models, such a situation precedes an extended quiet phase called a grand minimum. "Changes in symmetry are more indicative of going into a grand minimum than the strength of the cycle," he says.
-
Hi C-Bob!
I'm happy to see you still keep an eye on us in here!!
From what I'm given to believe the impacts that particulate pollution impart are far greater than any solar variation we have measured? The 'Horizon' docu had a guy advising us that climate models had used a figure fro lost solar (due to dimming) of 0.5 to 1% but the global average of deflected solar seems to be nearer to 10% of that arriving here?
Hi there, Gray-Wolf
Still keeping half an eye on the board every now and again, just waiting to pop up and spew my usual stuff when everybody least expects it!
No time at the moment to elaborate further, but the whole crux of the LI hypothesis in the first place was that solar variations were not given their due impact. Just because a scientist (or scientists) say they have taken solar variation into account does not necessarily mean that they actually have. The sunspot cycle clearly correlates with global temperatures, even over the last hundred years, as was shown by a (comparatively) simple mathematical equation, into which were added real-world numerical values.
There's more here than meets the eye...!
=)


 (Have to resist the urge to call you VP!)


The LI Revisited (Climate Modelling Using a leaky integrator)
in Climate Change
Posted
Ice extent is a proxy for albedo in this model. We can take it out if it makes you feel better, but your point is irrelevant.