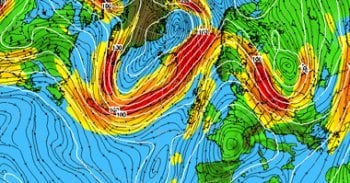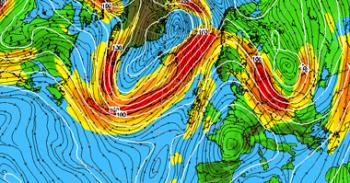
1st half of month: unsettled at times, chilly first 5 days, with frost risk overnight, then temperatures will recover to slightly above average by the weekend of 9-10th, as winds veer more southeasterly to the southwest of a blocking high over Scandinavia and low pressure moves to the southwest. Turning chillier again from week commencing 11 th , as an easterly flow develops for a time, as blocking high pressure over Scandinavia extends further west and pressure falls over the near continent. Most places becoming drier for a time but showers still possible in the south and east. Then a signal for a return of milder and more unsettled conditions, with rain at times, from the west by mid-month
2nd half of month: Although there’s a great deal of uncertainty, it appears most likely areas of low pressure over the Atlantic will continuing moving in across the UK at times, bringing mild and unsettled conditions to the south, but it may remain cold enough across the north for a mix of rain and hill snow. Later in the month, there is an increasing signal for high latitude blocking to develop, as the wind reversal in the stratosphere from the SSW early in the month perhaps starts to affect the troposphere weather patterns. Blocking high probably centred over Greenland, which could force the jet stream on a more southerly track, meaning southern areas may remain unsettled and mild, northern areas colder and drier, but risk of snow over hills when Atlantic fronts move north. Chance that colder conditions could spread south across all parts later in the month, but low confidence for now.
Probability for temperatures against 1991-2020 average: 50% chance of average, 30% chance of below average or 20% chance of above average.
Probabilities for rainfall: 40% of chance for average, 30% chance of below average, 30% chance of above average.
The lingering effects of the SSW early in March on weather patterns may persist into April, with a tendency for episodes of high latitude blocking, particularly around Greenland and Iceland, leading to a more southerly storm track than average over the Atlantic with lower pressure over mainland Europe to the east and southeast and high pressure to the north and northwest. This increases the chances of colder-than-average and showery conditions, particularly during the first half of the month, but coldest conditions most likely in the north. Rainfall mostly from showers. Some drier conditions likely too, especially in the west.
As we enter the second half of the month, blocking to the north may begin to lose its grip allowing low pressure to move in close to the west or southwest, bringing unsettled and milder conditions, with spells of rain and showers, across all parts. Rainfall amounts greater for all areas compared to the first half of the month.
Probability for temperatures against 1991-2020 average: 50% chance of average, 25% chance of below average or 25% chance of above average.
Probabilities for rainfall: 40% of chance for average, 40% chance of below average, 20% chance of above average.
Blocking high pressure could be present at times to the northeast or close to the north, bringing the potential for drier weather, but may be far enough away to allow low pressure to control UK weather at times too, briniging a mix of drier spells and more unsettled periods.
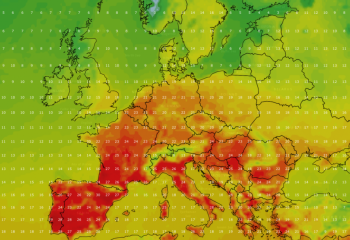
Overall, it’s looking like a warmer-than-average month, with the flow more likely from the east, south or southwest. Potential for one or two very warm spells, but risk of thundery weather, particularly later in the month. Rainfall likely to be around average overall, but perhaps quite wet in the west, drier in the east. The start of the month most likely to be drier than later in month.
Probability for temperatures against 1991-2020 average: 50% chance of above average, 30% chance of average or 20% chance of below average.
Probabilities for rainfall: 40% of chance for average, 30% chance of below average, 30% chance of average.
There have been two sudden stratospheric warmings (SSWs) since the New Year, one occurred in January and another one more recently around 18/19th February, but the stratospheric polar vortex quickly recovered following each of these brief reversals. It’s rather rare to witness 2 SSW events in the same winter, having only occurred 7 times since 1950, with the most recent back in 2009.
There is another SSW forecast in early March, the reversal around 5/6 th , which looks more sustained this time and it may even be a final stratospheric reversal (FSW) with no recovery of the polar vortex until late autumn.
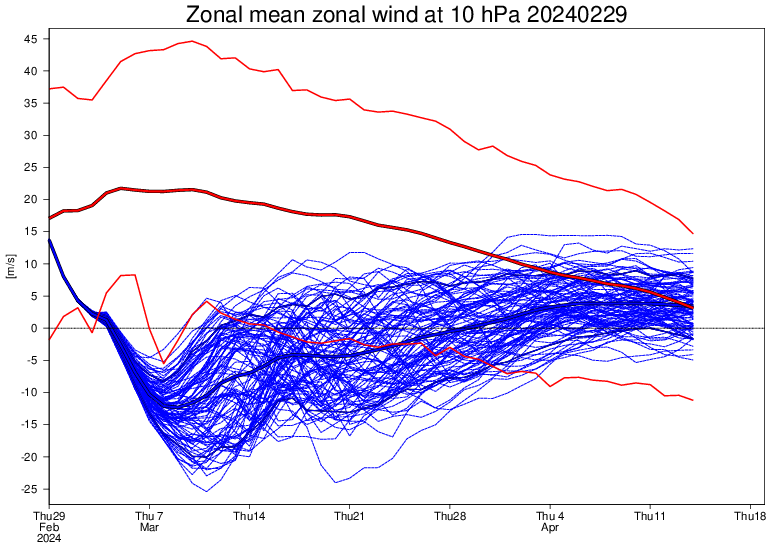
EC46 zonal mean zonal wind at 10 hPa
Around two out of three major Sudden Stratospheric Warmings lead to a Negative North Atlantic Oscillation (-NAO) which is often associated with blocking high pressure at higher latitudes of Greenland and/or Scandinavia – which forces the Atlantic storm track further south and also causes cold air to push south into Europe, including the UK. The NAO is closely related to the Arctic Oscillation, so when the NAO goes negative the AO goes negative too, pushing cold arctic air south to lower-latitudes.
It usually takes a week or two for the reversal to propagate from the stratosphere to the troposphere, where our weather happens. Sometimes it can be a more rapid response in the troposphere. Even it does happen and initiates high latitude blocking, there is no guarantee that cold air will reach the UK, as areas of low pressure and high pressure need to align in a particular way for this to occur.
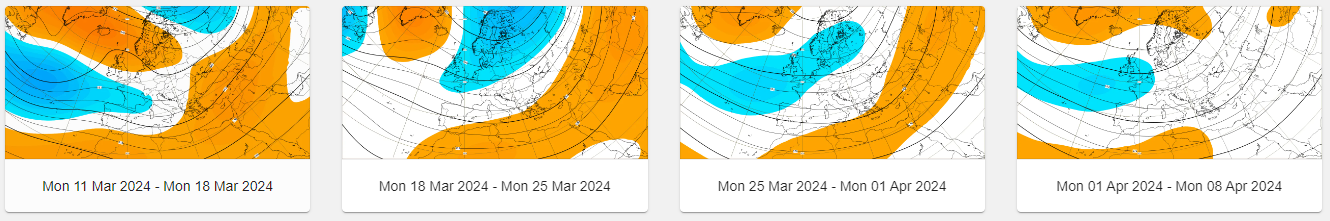
Longer range modelling, EC46 for example, has been forecasting high latitude positive height anomalies to the north from Scandinavia to Greenland, indicating potential for blocking high pressure at times during March. Most recent medium range runs have been persistently suggesting blocking high pressure developing to the northeast before the block migraties toward Greenland with time.
Although the MJO is a wave of enhanced convection that circum-navigates the global tropics, it does impact the upper patterns at high latitudes of the northern hemisphere, so is a useful tool to use for predictions for 3-4 weeks ahead, but no more than that really.
The MJO, although occurring the tropics, has far-reaching impacts on northern hemisphere extratropical weather through Rossby Wave propagation. The Rossby Wave propagation depends on the longitude of where the enhanced convection associated with the MJO wave takes place. As the MJO has a significant impact on northern hemisphere weather patterns, including the North America, Atlantic and Europe, there are correlations that can be made between the 8 different phases of the MJO and the lagged impacts on the upper air patterns that might be expected over the North Atlantic and Europe based on composites of previous events. The impact of the MJO on North Atlantic and European weather patterns depends on the strength of amplitude of the wave.
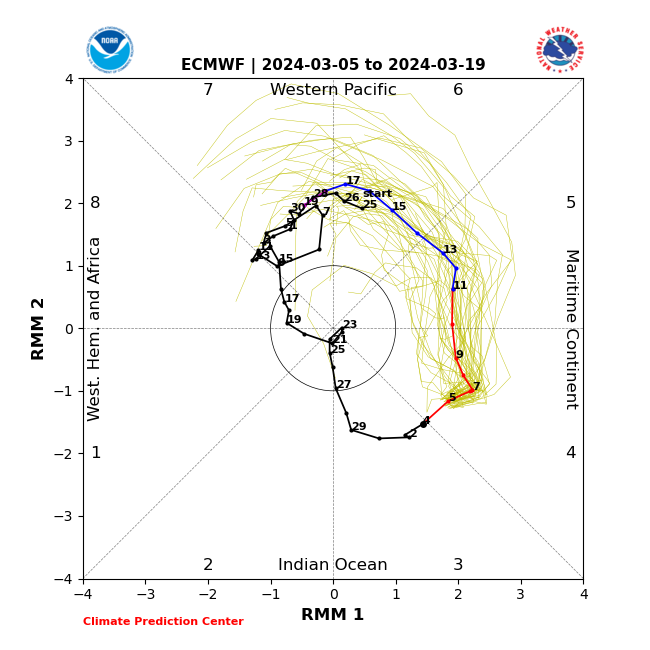
The Madden Julian Oscillation (MJO) looks to transition through phase 4 and 5 during early the first half of March. Lagged composites would favour high pressure to northeast initially bringing an easterly flow to the UK, then the high to the northeast migrating west to Greenland (Phase 5). However, this is only one piece of the puzzle, with destructive or constructive interference possible from other teleconnections such as the likely SSW event, especially if there is a fast tropospheric response.
There are no hard and fast rules over how ENSO impacts European weather patterns, whether its in El Nino, neutral or La Nina. El Niño or La Nina primarily affects weather patterns in the tropics, but changes to the weather in these regions can have knock-on effects all over the world. Even thousands of kilometres away in northern Europe, El Niño, on average, tends to cause colder and drier winter weather in northern Europe, by altering the track of the jet stream. But this has not been the case this past winter apart from Scandinavia – which has seen below-average temperatures.
Yet many factors affect European weather, especially during winter. So care is needed when linking unusual weather events in Europe to El Niño. This past winter shows that other factors, such as the stratosphere and even Atlantic sea surface temperatures – linked to global warming, could be overriding the usual El Nino signal.
The most recent update from the NOAA Climate Prediction Center’s ENSO: Recent Evolution, Current Status and Predictions:
El Niño conditions are observed.
Equatorial sea surface temperatures (SSTs) are above average across the central and eastern Pacific Ocean. The tropical Pacific atmospheric anomalies are consistent with El Niño.
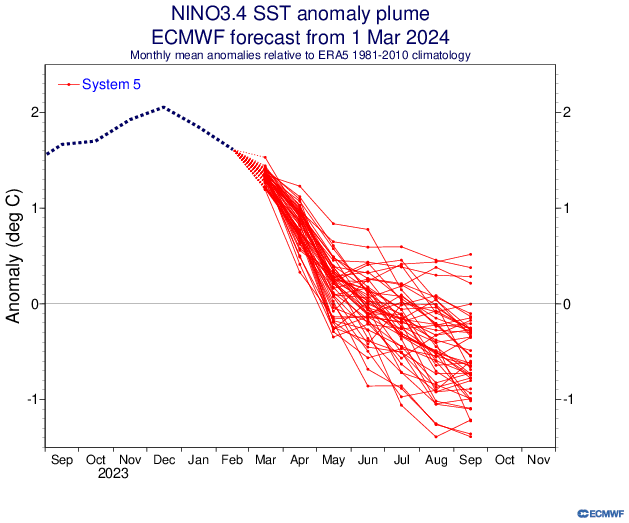
A transition from El Niño to ENSO-neutral is likely by April-June 2024 (79% chance), with increasing odds of La Niña developing in June-August 2024 (55% chance).
El Niño conditions continue, but a transition to an ENSO neutral state looks likely by May. This spring forecast will be influenced by weakening El Niño, weakening and early demise of the stratospheric polar vortex and model output, while leaning towards long term trends of spring seasons that have features a transition from strong El Nino to start the year to La Nina by autumn. There are increasing chances of a La Niña developing by late Summer into the Autumn.
While the ENSO teleconnection towards the Pacific North American region is well-researched and understood, there are still many processes that blur the ENSO signature over the North Atlantic-European region.
The way ENSO is used in this forecast will be to draw weather pattern composites of previous spring months featuring a transition from strong El Nino to neutral in Spring.
The North Atlantic SST tripole induced by the winter North Atlantic Oscillation (NAO) forcing can penetrate deeply into the bottom of the oceanic mixed layer. Sea surface temperature anomalies persist and cab exert a positive feedback on atmospheric circulation in late winter. In late winter and early spring, the surface heat flux anomalies are upward and downward over the warm and cold SSTA respectively. Studies have shown that the North Atlantic SST tripole induces a strong NAO-like response only late in the cold season (February-April).
The positive phase of the tripole SSTAs pattern in the North Atlantic, which features a warm waters over the central North Atlantic and two cold centres over the south of Greenland and the subtropics, can persist from late winter to spring. The positive phase can lead to increased atmospheric baroclinicity over the North Atlantic due to enhanced SST-induced temperature gradient between central N Atlantic and colder waters to the north, so the storm track is enhanced in the mid-to-high latitudes of the North Atlantic and high pressure induced over mainland Europe, which is located to the north of the warm SSTAs over the central North Atlantic, thus bringing milder and wetter weather to the UK.
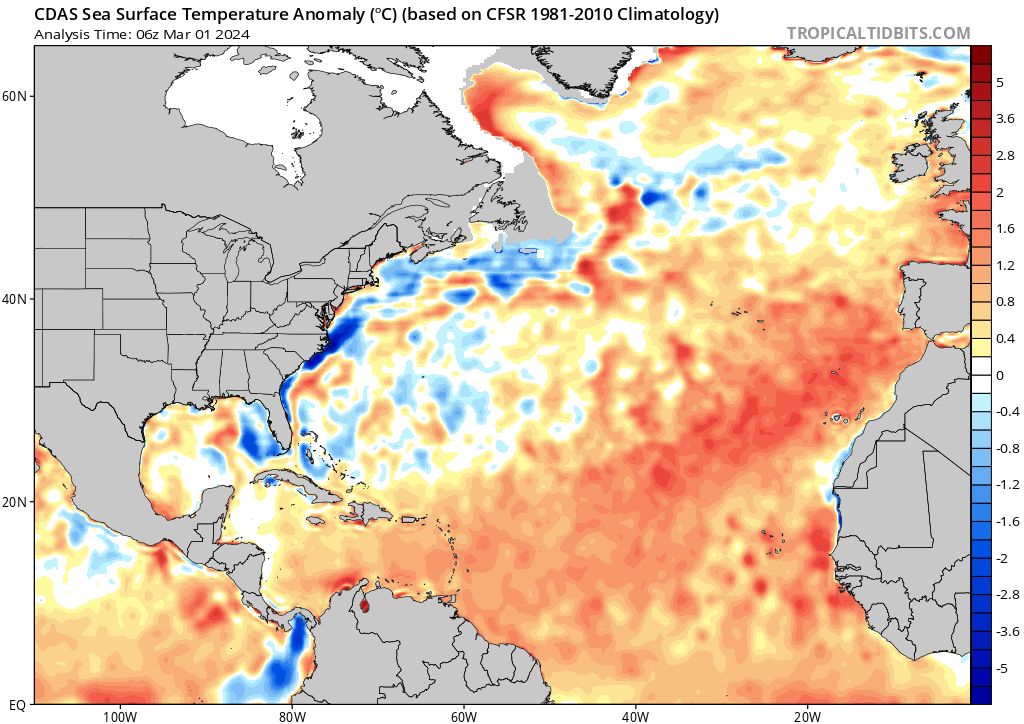
Conversely, with the negative phase of the tripole, there is a weak one now, manifests as warm waters south of Greenland, cold waters over the western central North Atlantic and warm waters to the south are present. The heat flux between the anomalously warm waters south of Greenland and cooler waters off the eastern seaboard of North America weakening the background equator-to-pole SST gradient. This could reduce storm activity downstream as we head into spring, weakening the surface eddy driven jet or shifting it equatorward and weakening the surface westerlies at this latitude – leading to a -NAO.
Furthermore, often in winters that feature a strong El Nino, the NAO remains positive through much December and January, bringing mild and wet conditions to northern Europe. This +NAO pattern leads to SST tripole developing in early winter, reaching its zenith in January. In late winter, the persistent SST tripole anomalies actively feedback upon the atmospheric circulation through diabatic heat forcing and transient eddy forcing. So in February or March, the atmospheric circulation anomalies often reverse the NAO pattern from positive to negative, particularly in the downstream region over Europe.
Given the negative tripole pattern over the winter, there could be an increased chance of -NAO pattern evolving, regardless of impacts of SSW, though a SSW will likely increase the chances.
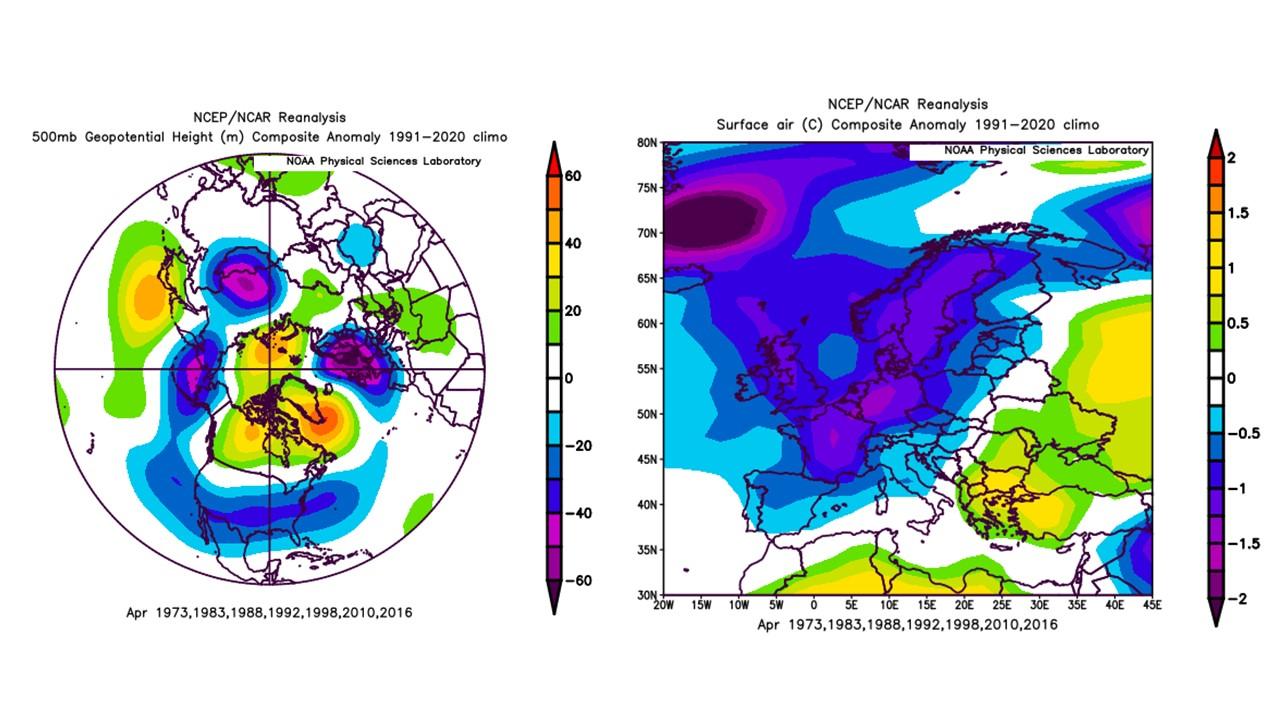
My top analog years combine years with strong El Nino trending neutral in spring, these years were 1973, 1983, 1988, 1992, 1998, 2010 and 2016.
I will only use the composites for April and May, as the extended model forecasts of EC and CFS will have better skill, given they will be using current atmospheric states, including the SSW forecast next week. Over a month out and the analog composites, combined with seasonal forecast will be relied upon to make some assumptions on how patterns may play out.
For April: the composite 500mb anomaly pattern for the years selected show low height anomaly close to the east and higher height anomaly to the west and northwest, strongest anomaly over Greenland. The composite temperature anomaly shows below-average temperatures across the UK.
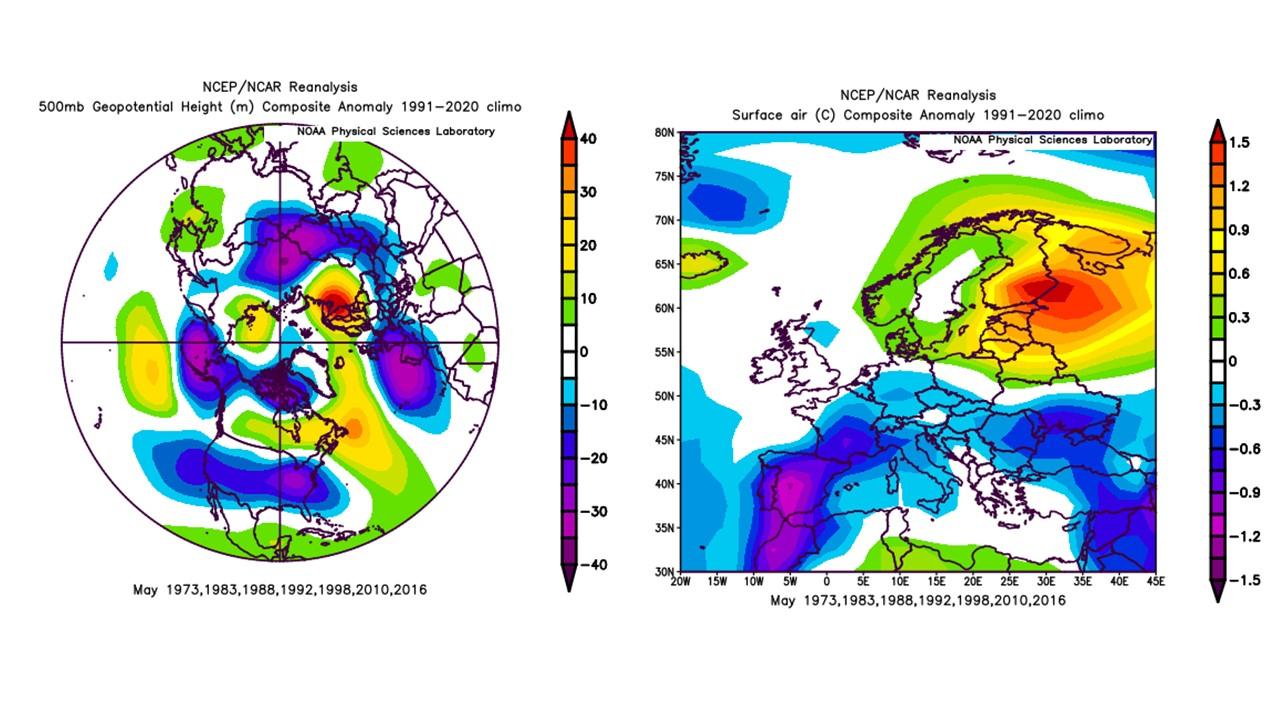
For May, low height anomaly over much of mainland Europe, but most prominent close to SW Europe, higher heights over Scandinavia to Iceland. Temperature anomaly is around average.
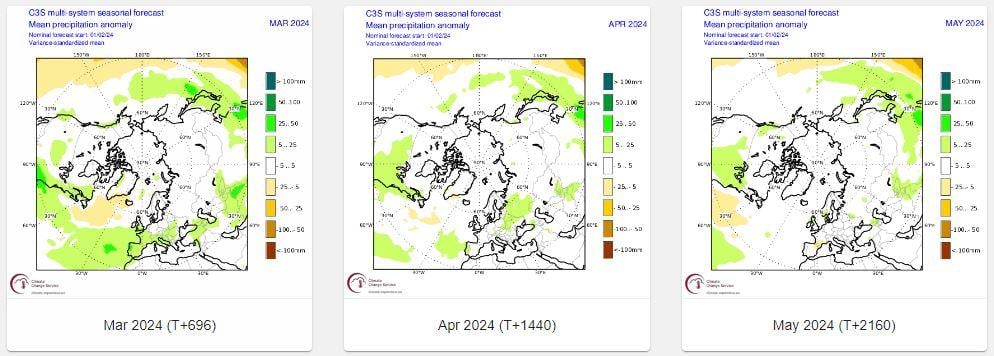
The February update to the C3S multi-model prediction forecasts for March/April/May 500mb and precipitation are below.
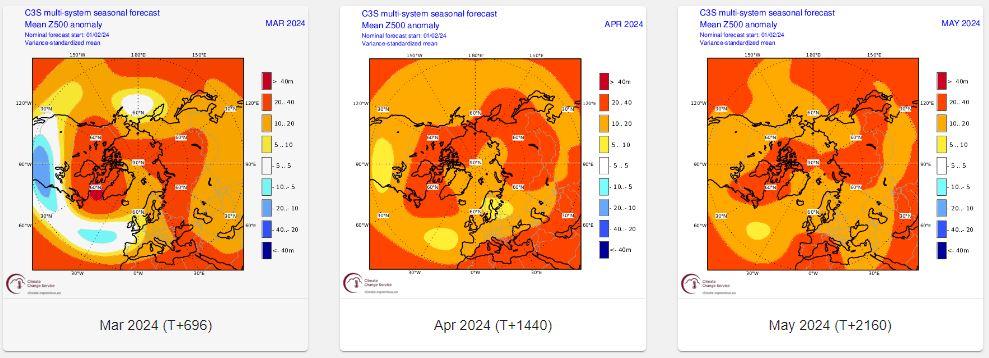
For March: a marked low height anomaly to the SW over the Atlantic edging into western Europe and higher heights over Greenland. This indicates a -NAO pattern may dominate at times. Precipitation anomaly more skewed to greater rainfall towards the south of UK, lower towards the north. April, a similar 500mb pattern to March but weaker signal to the SW and also lower heights to the east. Precipitation average. May – the signal for 500mb is faint, but lower heights mid-Atlantic, higher heights over SW Europe in the mean would suggest warmer patterns at times with flow from S or SW.
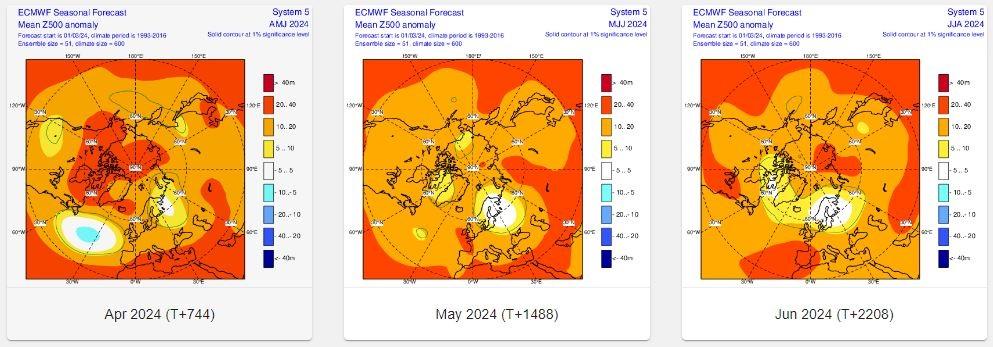
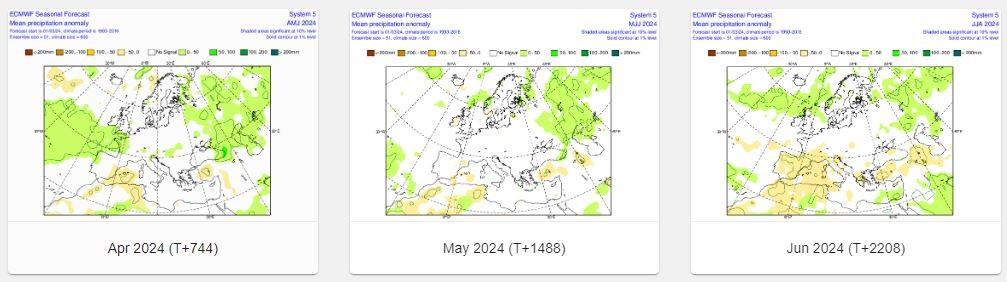
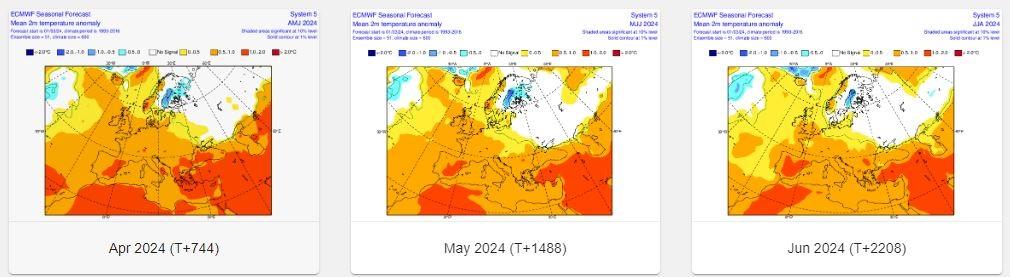
Will also consider ECWMF seasonal forecast for April and May for 500mb, temperature and rainfall. Again, it was updated more recently on 1 st March. It indicates April and May having above average temps. Rainfall looks average. At 500 hPa it shows lower heights signal to the SW for April, low heights signal over Scandi in May cool so a cool and unsettled NE Europe.
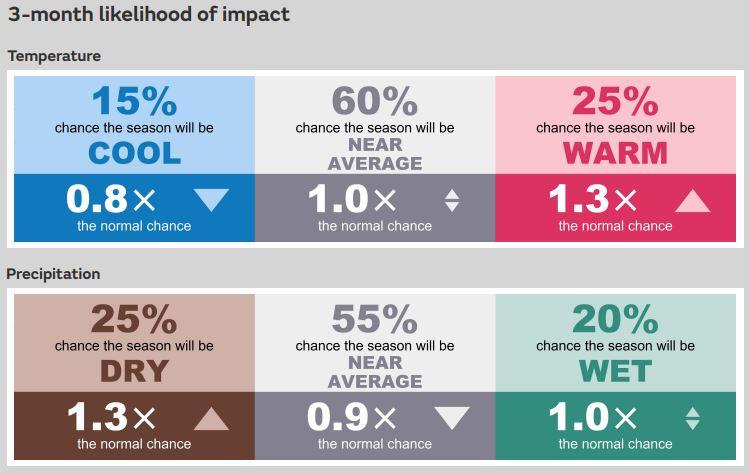
Also, the UK Met Office contingency forecast is out. They are forecasting March temperatures to be have a 60% chance of being near average, 25% colder than average, 15% milder.
The 3 month likelihood for temperature is 15% below; 60% near average; 25% warmer. So greatest chance of an average spring temperature-wise.
On top of the effects of climate change, there is extra warming of the global atmosphere from El Niño. This phenomenon means the ocean over the central and eastern tropical Pacific has warmed and that has major consequences for the weather all over the world. Years with an El Niño are warmer than usual worldwide. The combination of a warming climate and El Niño has made each of the last 10 months (up to January) break the previous highest monthly temperature record for each month globally since measurements began.
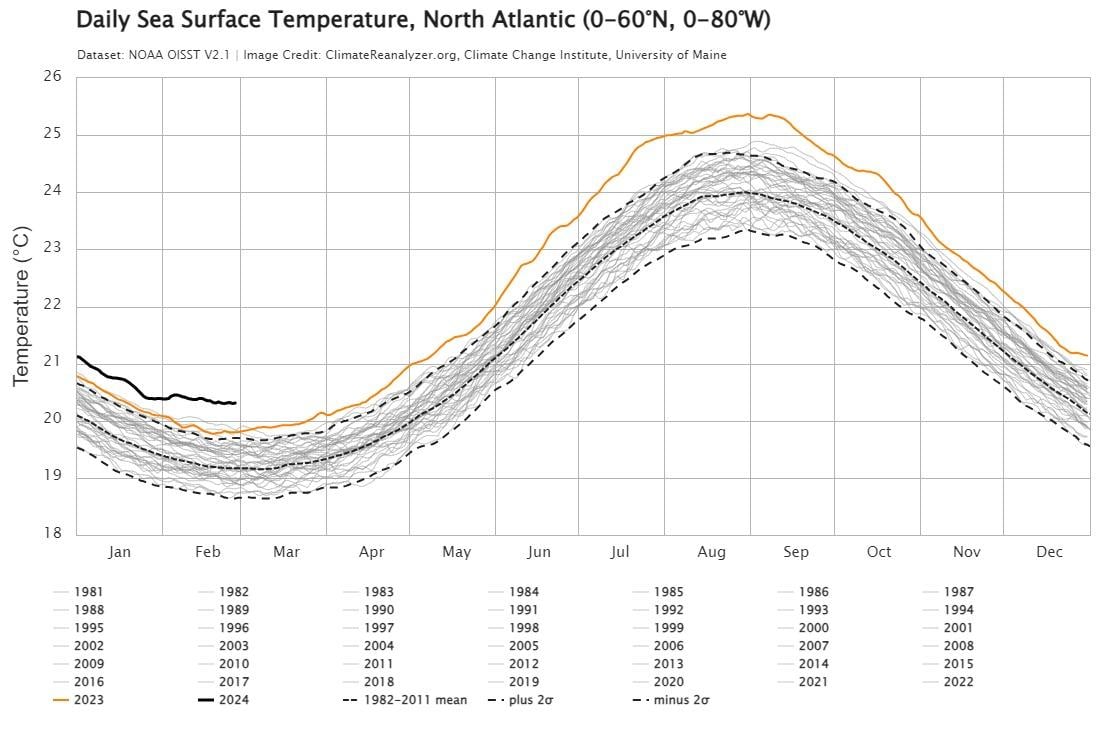
The excess warmth globally has manifested in record warm sea temperatures globally, as oceans absorb the excess warmth. We are in new territory for North Atlantic Sea Surface temperatures - which never been as high in the northern hemisphere winter before. And because of this, using analogs of months with similar ENSO trends, MJO, QBO, etc can lead to large errors due to excess warmth from oceans around the world altering weather patterns, such as expanding the Hadley Cell further north than usual, pushing Atlantic storm track further north, for example, this past winter – leading to unusually mild winter across much of Europe away from Scandinavia – where it’s been cold.
The extra warmth stored by the Atlantic and fed back into the atmosphere is making below average temperatures less obtainable, despite favourable synoptics and airmass origins that would support below-average temperatures in the past. So this is taking into account when predicting probabilities of below average/average/above average temperatures.
Stay upto date with the long range forecast throughout the year with the Month Ahead Forecast - Updated Every Monday.