Click to enlarge

|
Winter 2009/10 Preliminary Forecast
This article issued on the 6th November and written by Netweather long range expert Stewart Rampling outlined his preliminary thoughts ahead of the release of the full winter forecast on the 24th November. Both of these forecasts would normally only be made available to commercial clients, but are being made freely available on Netweather this year.
Netweather.tv Winter Forecast Bulletin 2009
�Doing the Stratospheric Shuffle � another cold winter beckoning?� Netweather.tv�s official winter forecast for 2009/10 will be issued on the 24th November 2009. This bulletin previews the key variables which we think will influence the broad pattern and aims to provide a preliminary indication of our thoughts on the period December through February 2009. In preparing this bulletin, we have taken account of the importance of the planet�s oceans in influencing seasonal weather patterns, how the atmosphere is likely to behave given an unusually long and deep low point in solar activity and how these two components are likely to interact within a coupled ocean-atmosphere system. The bulletin is based upon an understanding of atmospheric processes and model guidance provided by Netweather�s own customised forecast data. As a pretext to the bulletin, we are reasonably confident, even at this early stage, of the likely general arrangement of ridges and troughs across the Northern Hemisphere. The detail of how much cold develops and roughly how close this gets to western Europe are still very much open to doubt and there is a low confidence at this stage for the temperature forecast. A few hundred miles could mark the boundary between severe cold air mass and milder air and the boundary of these air masses is currently difficult to predict. Consequently, there is likely to be a wide variation of seasonal forecasts from various forecasting agencies this winter ranging from much above to well below temperatures. A much clearer indication is expected midway through November however it seems likely that pressure will be low over the western Atlantic, higher over the Canadian Arctic with a particularly cold Russian winter. Such patterns were prevalent during cold winters during the 1960s and 1980s over much of Europe. El Nino Southern Oscillation (ENSO) El Nino Southern Oscillation is a major climate phenomenon which impacts global weather patterns on an intra and inter seasonal basis. There are three forms � El Nino, La Nina and ENSO neutral. This year, anomalously warm waters occupy the central and eastern equatorial Pacific characteristic of an El Nino event. Since the spring, a large body of warm sub-surface water has developed in eastern Pacific. This has steadily moved upwards and westwards as a result of oceanic waves and a complex process which involves long term weather-climate processes. El Nino
Click to enlarge Temperature Anomalies
The pressure anomalies associated with all El Nino events from 1950 onwards are shown below with a distinctive pattern of low pressure in the north-west Pacific, higher pressure over Canada, an increased sub-tropical jet stream over Florida and weak high pressure and above average temperatures over large parts of Europe.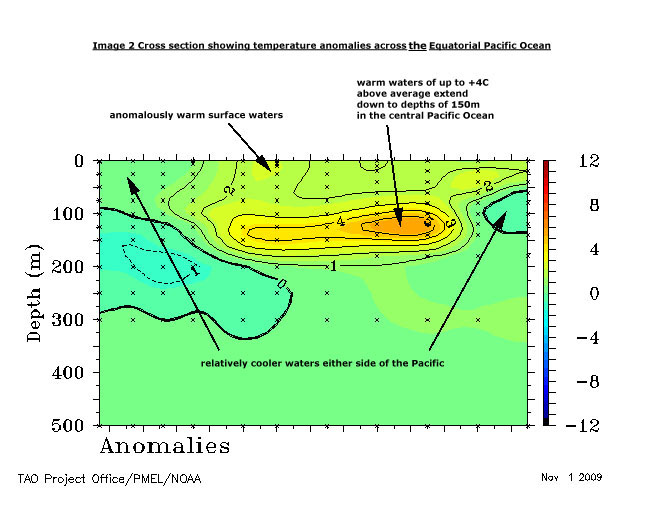 Click to enlarge Pressure Patterns
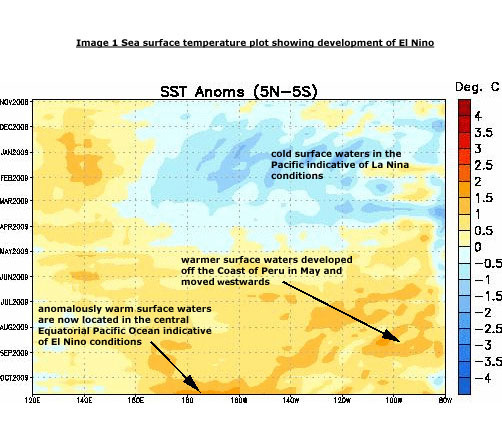
Global weather models have tended to over-forecast the speed and magnitude of the development of this El Nino event. This has lead to false summer forecasts which were premised on the basis of El Nino engaging with the overall global weather pattern, something which should be borne in mind when considering the winter forecast. This was probably related to a global weather pattern which was deeply imprinted with a La Nina-like pattern resisting El Nino, and which may also be linked to an unusually prolonged quiet phase in solar activity (more on this later).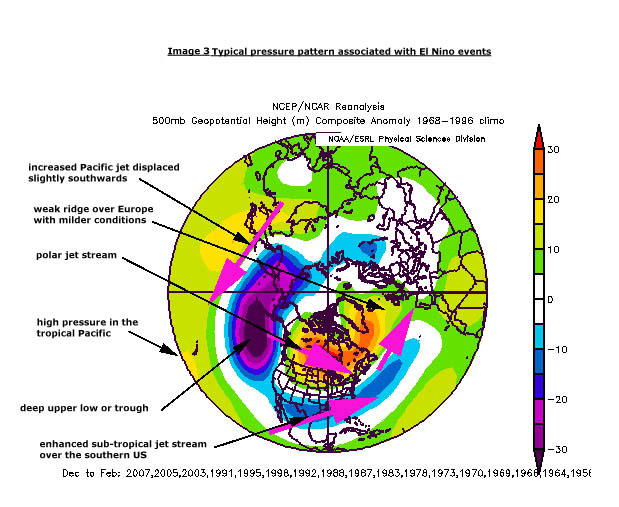 Click to enlarge Since May, there have been a series of bursts of westerly winds in the Indian Ocean and subsequently in the western Pacific. Westerly winds flowing across these regions are indicative of an increasing influence of El Nino. Each burst of wind tended to shift eastwards by approximately 10 degrees longitude. The latest has triggered a significant warming of the central equatorial Pacific by allowing the anomalously warm sub-surface waters to move to the surface. Consequently, the latest surface temperature anomalies are between +1.4C around the Dateline, +1.2C in the central-eastern Pacific and +0.2C in the eastern Pacific. This places the Nino event in the moderate strength classification. Zonal Winds
Models vary in their forecasts for the intensity of this El Nino although all suggest that it will be in place over the winter time, generally at moderate or even strong strength. Latest buoy data identifies a body of water at up to 150m depth which is up to +4C warmer than normal in the central Pacific. Westerly wind bursts are key triggers for warming of El Nino waters. These tend to operate on 6 week intervals. This means that the next westerly wind burst will take place during mid to late November and, given the favourable environment in front of it, this wind burst is likely to be shifted 10 degrees further east than the last placing it close to the Dateline. Once west winds breach this point, it is usually a trigger for full blown El Nino events to develop and warm subsurface waters to be drawn to the surface. This supports model forecasts for a moderate or strong El Nino to develop from late November onwards.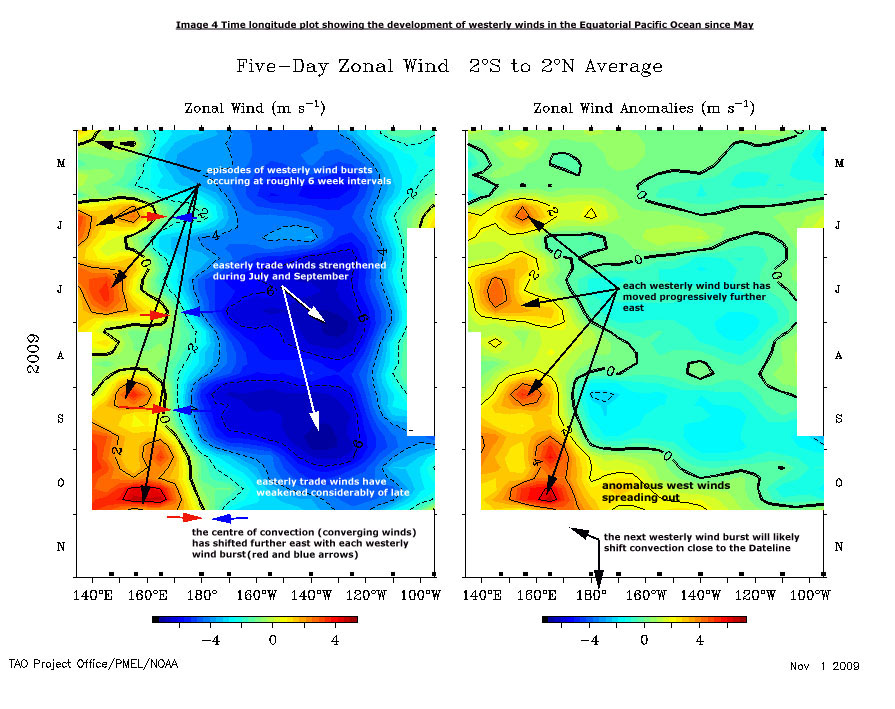 Click to enlarge A distinctive pressure pattern is associated with El Nino events. However, not all Ninos are the same with notable differences for European weather patterns. A number of El Nino events, essentially the weaker ones, have tended to correspond with episodes of cold weather in Europe as pressure rises over the Arctic and jet stream is forced southwards over the Mediterranean. The key to understanding how El Nino might impact the global weather pattern is to consider how strong other factors are. The influence of sea surface temperatures elsewhere in the Pacific, Atlantic and likely state of the upper atmosphere are important in modulating the net impact of El Nino. The existing global weather pattern which is imprinted with a La Nina like pattern should also not be forgotten and this is unlikely to go down without a fight. Northern Hemisphere Ocean temperatures A tour of the current sea surface temperatures (SSTs) identifies the following pattern. Global SSTAS
Due to the lagged influence of large bodies of water, these provide a useful guide over sustained seasonal periods, particularly where warm and cold anomalies exist in close proximity and those between the equator and 40 degrees north.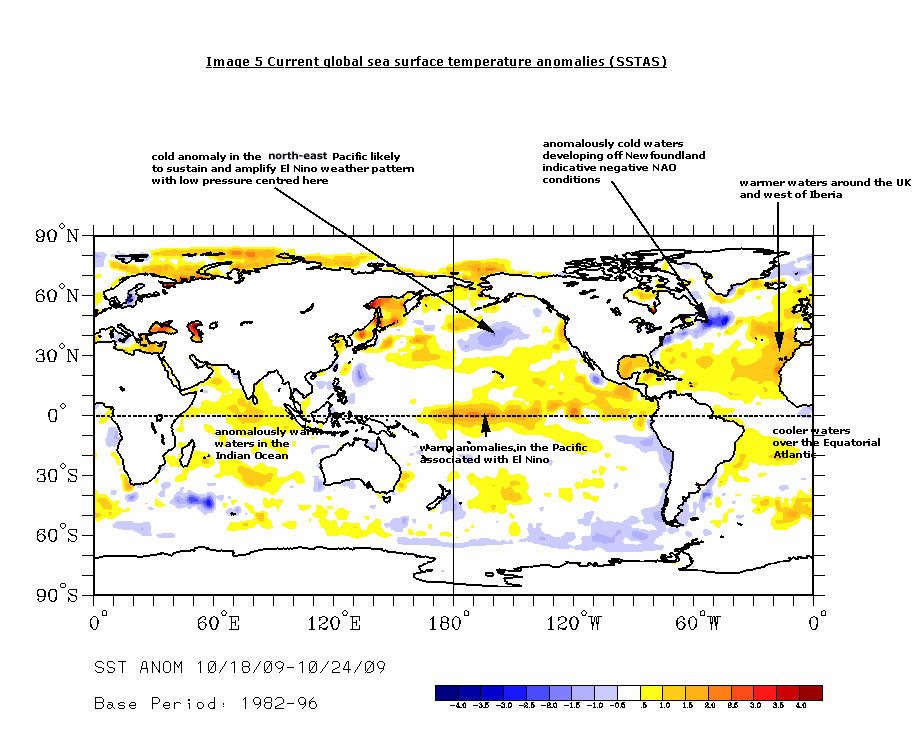 Click to enlarge The developing El Nino shows up nicely on the plots with warm SST anomalies extending across from Central America to the central equatorial Pacific. Note the focus of these anomalies � tending towards the central Pacific. This is unusual for El Nino events which tend to develop off the coast of Peru and then steadily expand westward. This event almost has the look of a mature El Nino event with cooler waters close to Peru. Reanalysis of El Nino events where the core of the warm surface anomalies was further west suggests a typical El Nino pattern but with colder weather and lower pressure filtering down from Russia into Scandinavia and parts of Europe. Pressure Patterns
In the north-east Pacific there is a pool of anomalously cold water. This is likely to persist over the winter given depth of cold water anomalies present here. This cold pool of water is also very important as it coincides with the location of the Pacific low associated with El Nino. Cold water anomalies lead to troughing or low pressure in the atmosphere and this will help sustain and amplify the impact of El Nino on the overall flow in the Pacific.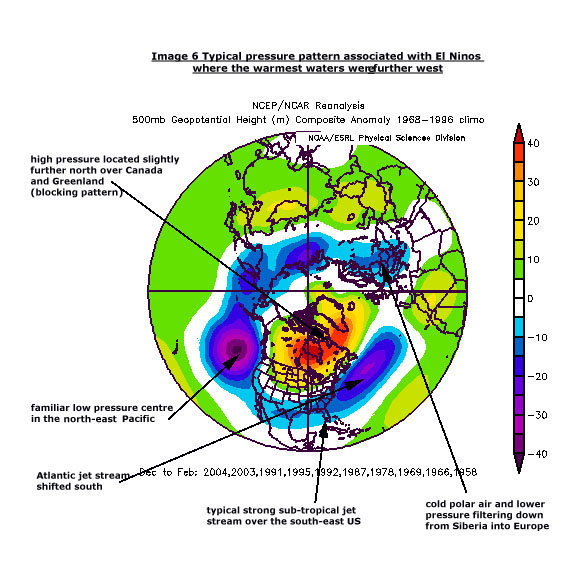 Click to enlarge In the Atlantic, there is a general arrangement of warmer than normal waters extending from the Caribbean to the African Coast and north around Iceland. Cooler than normal waters persist in the tropical Atlantic. There is also a growing pool in the north-west Atlantic off Newfoundland. This arrangement is indicative of a negative North Atlantic Oscillation (see below). More generally, if we study years with a similar arrangement of sea surface temperature anomalies, we get the following composite: Comp Re-analysis
The atmospheric response to this is not unsurprisingly an El Nino type pattern although it is of the colder variety for northern Europe with a notable low pressure anomaly in the Atlantic and strong positive high pressure anomaly over the Arctic characteristic of a negative Arctic Oscillation phase which corresponds to colder than normal temperatures over northern Europe and clear boundary between NE and SW parts.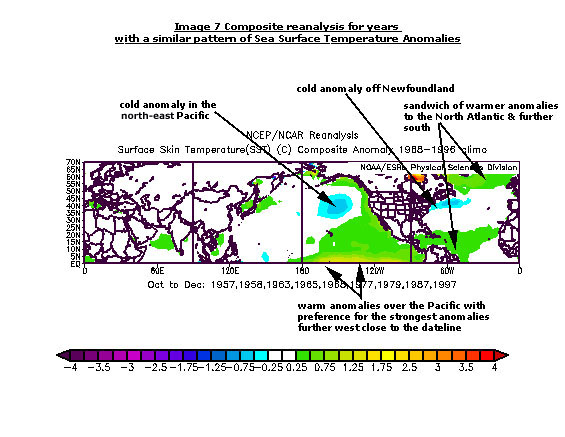 Click to enlarge Atmospheric Response
Also worth noting are the warmer than normal surface waters over the Indian Ocean which is a possible wild card and may disrupt any North Atlantic Oscillation signal.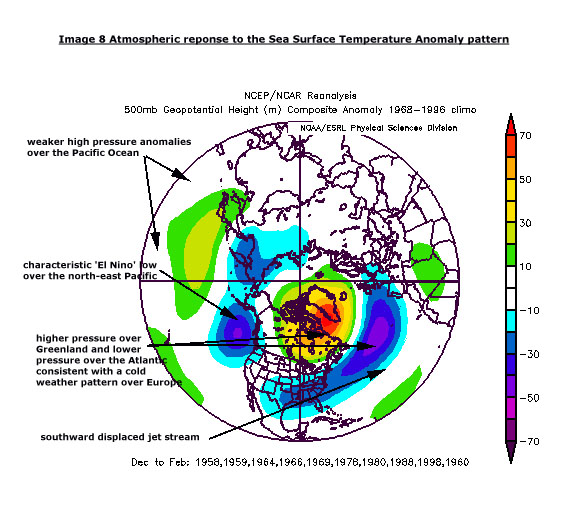 Click to enlarge The North Atlantic Oscillation (NAO) The NAO is a climate phenomenon which measures the difference in air pressure from the Azores to Iceland. A positive phase of the NAO results in milder winter weather for Europe whilst a negative phase is associated with colder weather. Atlantic Ocean temperatures are thought to be the key driver on the NAO � the Met Office for example have statistical forecast which is based upon surface water temperatures during the preceding May. However, we consider the NAO to be a much more complex product which is deeply related to a number of global factors. Analysis of the top ten negative or positive NAO winters identifies a distinct pattern in cloud and thunderstorm activity across the Pacific, Indian Ocean, Atlantic and Africa. Longwave Radiation
Thunderstorms or tropical convection generate downstream high pressure cells which in turn generate large-scale planetary waves which can influence the height of the tropopause in the North Atlantic explaining low or high pressure in this area. Positive phases of the NAO are associated with weaker than normal thunderstorm activity in these areas whereas negative phases are associated with increased levels of cloud and thunderstorm activity. This mechanism also explains why some El Nino events (associated with enhanced thunderstorm activity and cloudiness in the central Pacific) produce negative NAO months and La Nina events which inhibit thunderstorm activity and which are associated with positive NAO phases.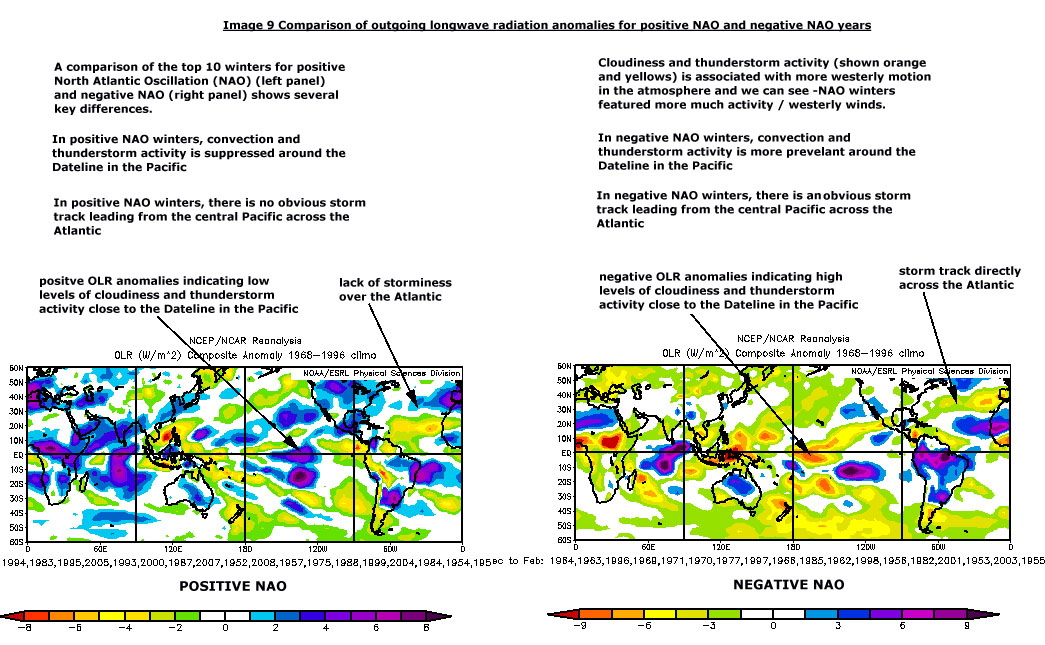 Click to enlarge Analysis of sea surface temperatures across the northern hemisphere on the 31st October for winters with a negative phase NAO shows the following signature: SST
This year, it looks as if a weak negative NAO signal is apparent. Thunderstorm activity is also likely around the Dateline in the Pacific because of El Nino and the next phase of westerly wind bursts (mid to late November impacting the atmosphere into December). Thunderstorm activity occurs over warm waters where convergent winds lead to rising unstable air laden with moisture. If the next phase of tropical waves timed mid January shifts this focus of thunderstorm activity east of the Dateline, the signal for a negative phase NAO will be strengthened. Conversely, if convection is weak and further west than anticipated, the NAO will likely be more positive.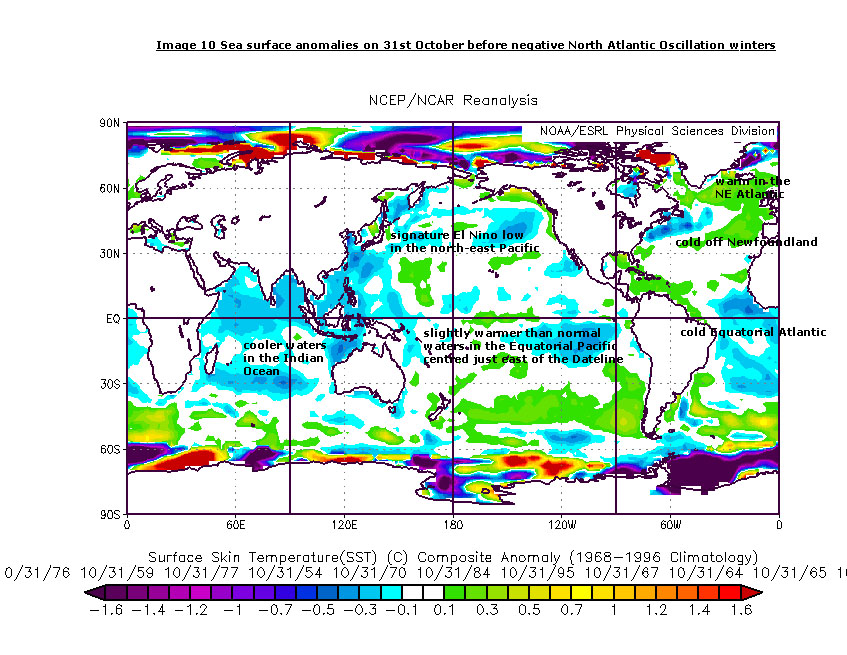 Click to enlarge The NAO is also linked to the Arctic Oscillation (AO), particularly during the second half of the winter when high pressure over the Arctic (negative AO phase) can force the NAO negative through a large block developing over Greenland effectively deflecting the jet stream southwards. The biggest determinant of the AO during the winter months, especially during El Nino events, is the state of the stratosphere over the Arctic. The Stratosphere There are two types of El Nino winters. One with an anomalously cold polar stratosphere driving a deep polar vortex allowing the jet stream to flow well north of the UK penetrating into Scandinavia associated with very mild conditions and one with a warm stratosphere of the Arctic which deflects the jet stream southwards over southern Europe allowing cold Arctic air to flood across northern Europe. Both have the common denominator of low pressure over the Atlantic. Clearly, the state of the stratosphere will be a key determinant on how El Nino impacts the European weather pattern. Which set of stratospheric cards will be dealt this year? The stratosphere lies above the troposphere � the part where most of our weather is generated. There is a growing body of research on the influence of the stratosphere, especially on winter time weather patterns. A warm stratosphere occupies a larger column of air compared to a cold one and this influences the troposphere beneath the stratosphere by altering the height of boundary layer between the two. A warm stratosphere during the winter has been shown to influence high pressure at the surface over the Arctic, displacing cold air into the middle latitudes in what we call a negative phase of the Arctic Oscillation. A key to understanding how the polar stratosphere might behave is the Quasi Biennial Oscillation (QBO). This is a band of stratospheric winds across the tropics and equator which runs in an alternating east and west direction, switching between the two from 8 up to 22 months. The QBO has been shown to have a significant influence on the temperature of the stratosphere over the Arctic by altering the height of the boundary between the troposphere through the overall arrangement of upper level east and west winds and through a process known as the Brewer Dobson Circulation which transports ozone in the stratosphere from the tropics to the poles during the autumn. The influence of the QBO on the stratosphere varies with the phase (east or west) and the state of the solar cycle. This makes it difficult to prove a concrete cause-effect relationship, particularly as the data set is restricted to the 1950s onwards (that�s just 5 solar cycles). However, the evidence tends to suggest that east QBO phases occurring around the low point in solar cycles favour warmer polar stratospheres during the winter months and therefore more negative phases of the Arctic Oscillation at the surface. Conversely, a west phase QBO and low solar state favours a positive Arctic Oscillation and low pressure over the poles. We are currently in an east phase of the QBO and this is likely to last throughout the winter at moderate strength. Since 1950, there have been 45 clear instances of low solar (defined as lower quartile solar flux) and east or west QBO conditions across the northern and southern hemispheres during their respective winter months. 28 or 62% of these found the QBO / solar relationship to behave as anticipated. Whilst this might not seem overly impressive, those type of percentages are very good odds in terms of long range forecasting. In addition, a number of those years where the east QBO � low solar relationship broke down were characterised by overall circulations characteristic of La Nina. This is a major inhibitor to the movement of warming planetary waves into the polar stratospheres which cause warming so the percentages of a low solar � east QBO phase influencing a warm polar stratosphere are probably around 73%. The solar minima was due to be reached last year. However, contrary to forecasts for it rise, this year has seen a sustained lack of solar flares and activity remains very low. This means that we will have witnessed the most sustained and deep low point in solar activity since the 1960s if not since the early part of the 20th Century. This is undoubtedly going to have a sustained impact on global weather patterns for years to come, regardless of a possible increase in activity in the future. Previous low points in the solar cycles have tended to correspond with multi-decadal changes in the Pacific Ocean between cold and warm phases and the overall balanced of east and west winds across the planet (more on this later). Solar Activity
The impact of the low solar � east QBO regime may be already observed by looking at the temperature differentials in the stratosphere. Analysis of 30 hPa air temperatures during October shows that the stratosphere has been much colder over the tropics and close to average over the Arctic. Rising air over the tropics cools by a process of adiabatic cooling and warms through descending over the polar region. This suggests that the Brewer Dobson Circulation is being enhanced (as it should) by the combination of low solar activity and the east QBO. This type of activity preceded the exceptionally cold winters experienced in 1962/3 and 1986/7. There is still some time for this process to reverse and the stratosphere to cool over the Arctic as it has tended to do so over the last decade although the latest date supports the 73% probability being correct and a warm stratosphere to be in play.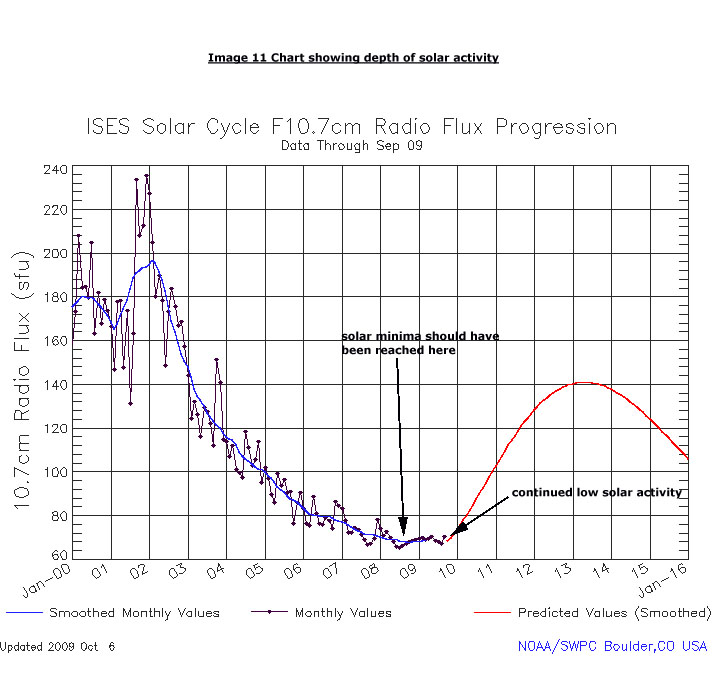 Click to enlarge Stratospheric Temps
Over the last year, the atmosphere has also shown a marked tendency for well defined waves to move up and down heavily influencing the seasonal weather patterns. These are related to the changing phases of the QBO. The most recent wave is moving down through the lower parts of the atmosphere and follows a summer where the wave moved up helping to sustain periods of unsettled and cool weather over northern Europe. Upward moving waves tend to favour rises in air pressure and this is something to consider given that the wave will begin upward motion over the Arctic sometime late November or early December and last throughout the winter. This is another factor favouring a negative Arctic Oscillation.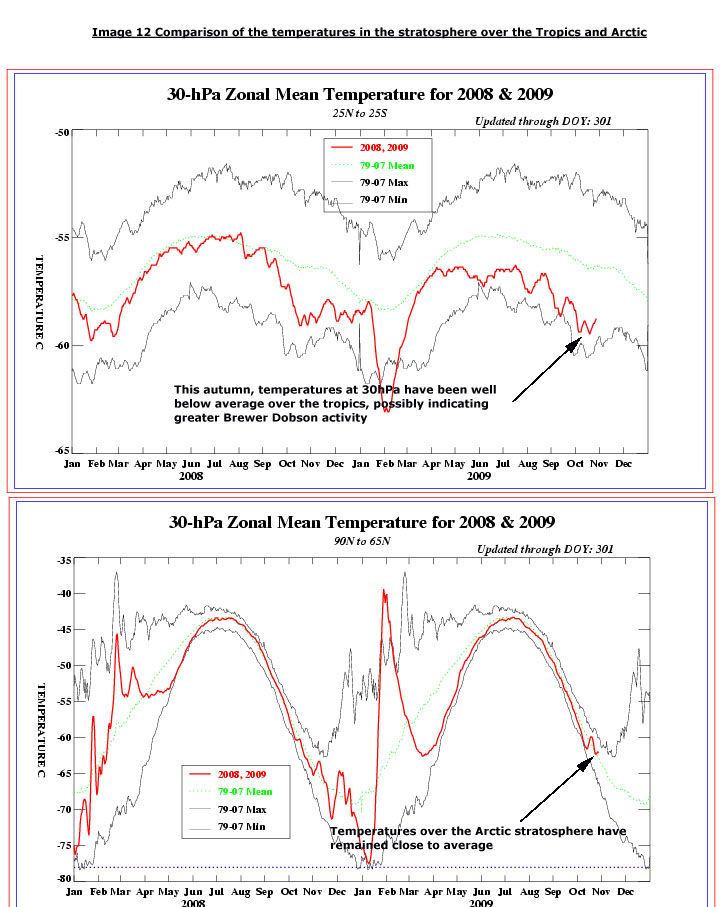 Click to enlarge Zonal Wind Anomalies
Global Winds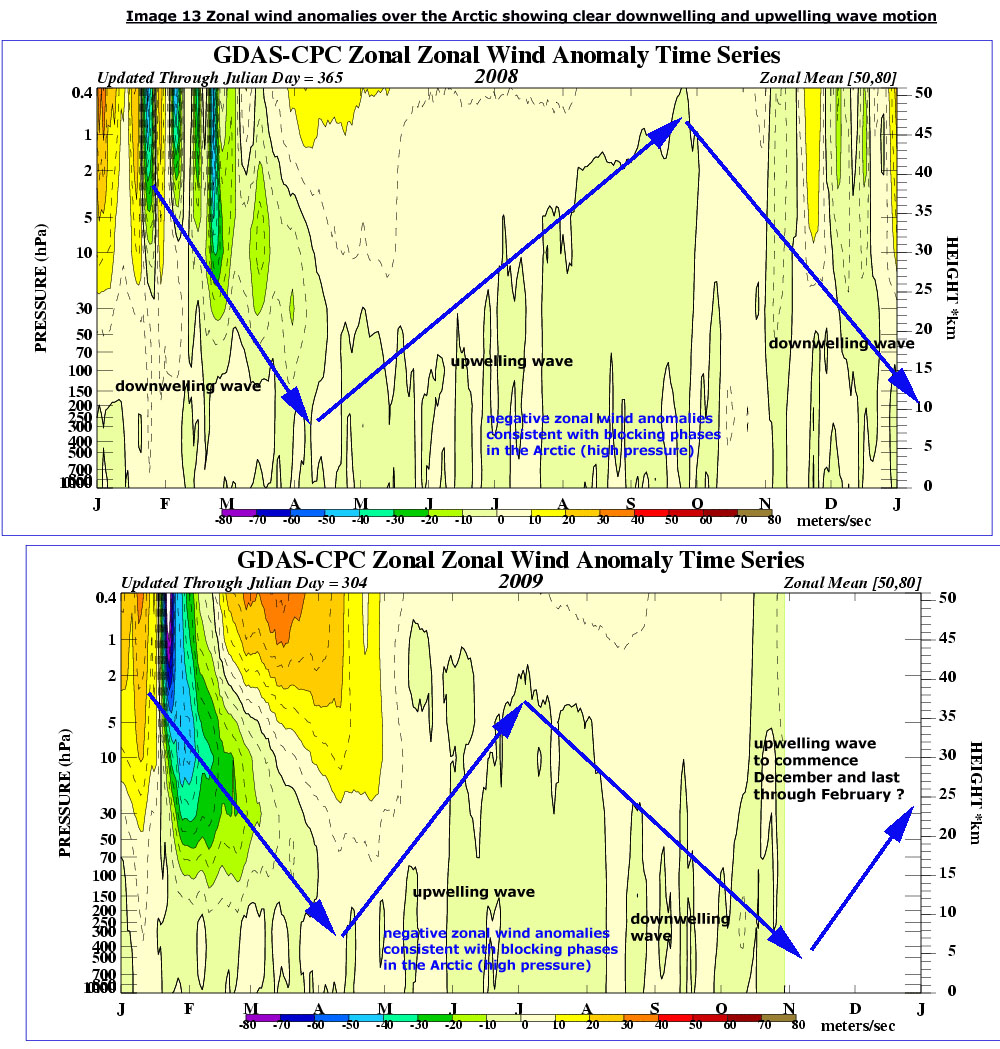 Click to enlarge Winds flow east to west across large parts of the globe, and at various different heights of the atmosphere. These form the basis of large scale meridional circulations such as the Hadley Cell which arrange alternating ridges (high pressure) and troughs (low pressure) from the equator poleward. The net balance of east or west winds defines the overall character of the global weather pattern. More west winds than east winds are characteristic of an El Nino type pattern. More east winds than west winds are characteristic of La Nina type pattern. Currently, the net balance of winds or globally averaged angular momentum (GLAAM) is below average indicating La Nina type weather patterns still persisting despite the presence of warm surface waters in the equatorial Pacific consistent with El Nino. This is probably related to the extended lull in solar activity although the east QBO, which as adding a 15 m/s component to the overall wind budget is also a factor. The correlation between El Nino and GLAAM is about 0.8 (where 1 = perfect positive correlation). This means that El Ninos should result in more west winds across the planet. However, there have been previous El Ninos which were accompanied by this peculiar disconnect with global winds running in the opposite direction or lagging significant behind El Nino�s strength. The most recent was in 2006 whilst 1986, 1972 and 1965 all featured El Nino events with an overall net balance of east winds globally. Further significant differences between El Nino and GLAAM was also observed during the winters of 2002/3, 1979/80, 1963/4 and 1958/9. All but one of these years had an easterly QBO in play whilst over half featured solar activity in the lower quartile. Reanalysis of pressure anomalies for these years shows a strong negative phase of the North Atlantic Oscillation (NAO) with pressure higher over Greenland and Iceland compared to lower pressure over the Azores and a cold winter pattern for much of Russia extending into northern Europe. This represents something of a hybrid pattern between the cold Arctic air build-up characteristic of La Nina and higher pressure over Greenland characteristic of El Nino. Pressure Patterns
Although it is still possible for GLAAM to crank up in response to El Nino forcing during the winter (remember the correlation), the continued low solar activity and east phase QBO, not to mention large bodies of anomalously cold water across the southern oceans (cold water tends to sustain easterly winds), will prevent significant net increase in global west winds.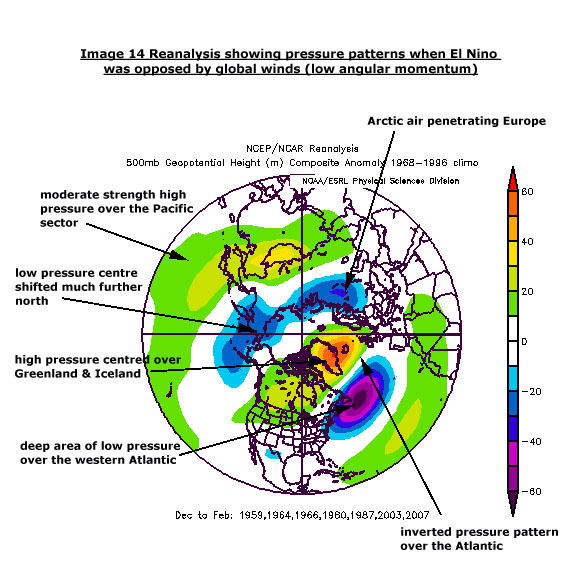 Click to enlarge If however global winds do respond to El Nino, the chances of anomalously cold weather over much of Europe become very much diminished. Compare the plot above with those El Nino years below where global winds had responded and where a net west wind balance was present in the global circulation. This shows low pressure over the Arctic and high pressure over the UK with mild and dry conditions favoured. Pressure Patterns
Global Wind Oscillation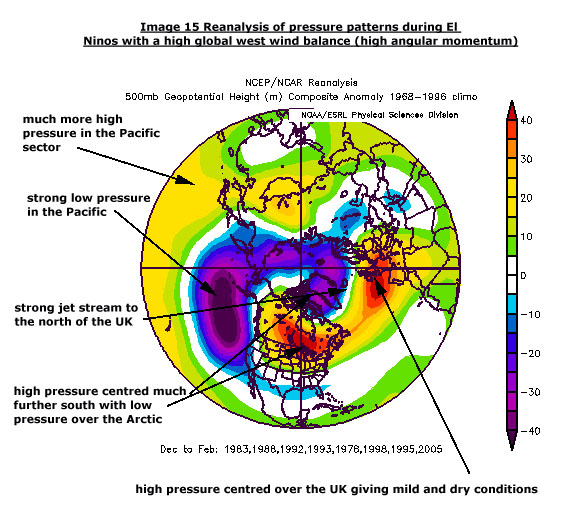 Click to enlarge The Global Wind Oscillation (GWO) is at the cutting the cutting edge of weather-climate research. It advances the concept of GLAAM a stage further to capture the dynamics of the interaction of atmosphere, oceans and landmasses across the tropics and extratropics so that it can be used as a predictive tool. The GWO identifies 8 phases or weather patterns, 4 La Nina type and 4 El Nino type. During strong El Nino episodes where the atmosphere is adding west winds to the system, the GWO orbits in phases 5 � 8 with a tendency or attraction to phases 5 and 6. These are associated with high pressure over Europe and low pressure over the Arctic and Iceland. A less powerful El Nino, or where El Nino has not fully connected with the global circulation, tends to result in smaller orbits of the GWO which can include phases 0-1-2-3-4-5-6-7. Phases 7-0-1-2 are associated with higher pressure over Iceland and the Arctic and lower pressure over Europe during the winter months. The current GWO shows a slight tendency towards the La Nina / low angular momentum base state. If El Nino fails to drive up GLAAM during the coming months, and remember the low solar state and east QBO are obstacles to this, then we can expect the GWO to orbit with a tendency towards phases 7-0-1-2. Global Wind Oscillation
Climate Forecast System (CFS) Model Guidance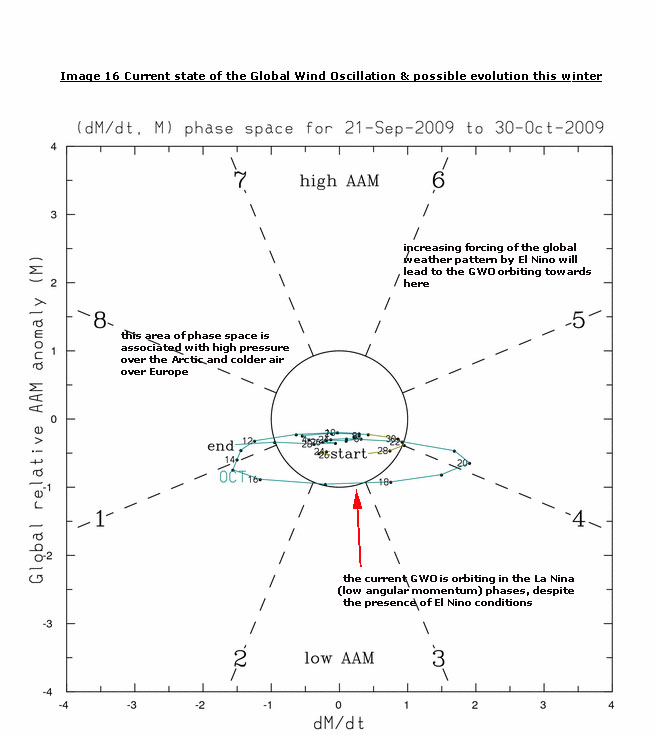 Click to enlarge Netweather.tv has a customised long-range weather model which takes data from the Climate Forecast System, a global weather model which uses many of the parameters considered by this winter bulletin. The model has been consistent in its overall programming for the winter showing low pressure in the north-west Pacific, low pressure in the Atlantic and in increasing tendency for pressure to rise over the Arctic during January and February. For Europe the model has varied suggesting temperatures between much below and average or slightly above. The CFS trend increases confidence in the overall arrangement of pressure during the winter although it also confirms some uncertainty over how much cold air develop during the early part of the winter over Siberia and how far west this cold air penetrates. The latest runs of the model are somewhat suggestive of a ridge of high pressure centred just to the west of the UK forcing a part of the jet stream northwards preventing the coldest air making it too far west. Preliminary indications Taking the into account the key atmospheric and oceanic variables, allied to model guidance, we consider the prospects for a cold and snowy winter to be finely poised. Some forecasting agencies such as the Met Office have indicated the chances of a below average winter to be 1 in 7. We think this is more like 1 in 3 with increasing potential for below average temperatures during January and the early part of February with a closer to average December. Overall temperatures are most likely to fall into the average or below average categories. The signal for precipitation is marginally towards average or above average during the winter. Our current thinking is based upon:
What to look for during November During the next few weeks, we will monitor the following variables to prepare our official winter forecast:
Bulletin issued by: Stewart Rampling - Long Range Forecaster, Netweather.tv
If you would like to download this forecast as a pdf, please click here.
Both the full Winter forecast and the standard long range forecast on Netweather will be updated on Tuesday 24th November. |