Blog looking at El Nino and its potential effects on the UK's weather in winter.
What is El Nino?
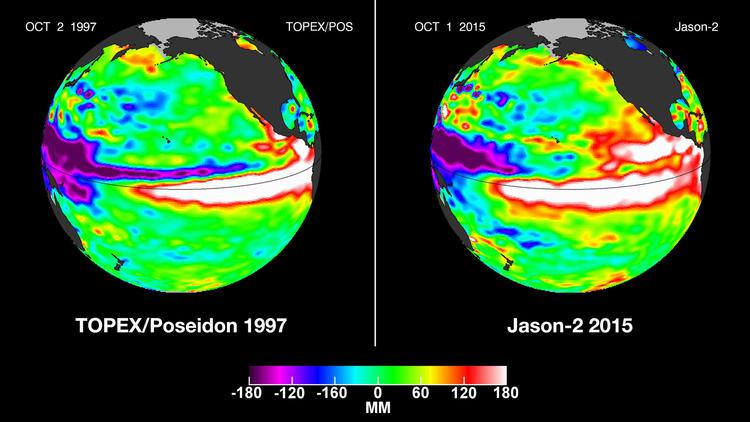
El Niño is the warm phase of the El Nino Southern Oscillation (commonly called ENSO) and is associated with a band of anomalously warm ocean water that periodically develops in the central and east-central equatorial Pacific. El Niño occurs every two to seven years, on average, leading to large-scale changes in sea level pressure, sea-surface temperatures, precipitation and winds, not just in the tropics but in many other regions of the world. Whereas El Niño’s opposite, La Niña, is characterised by unusually cool ocean water in the equatorial Pacific. El Niño means ‘The Little One’ or ‘Child of Christ’ in Spanish. This name was used for the tendency of the phenomenon to arrive around Christmas.
El Niño is officially considered when the sea surface temperatures in a key region of the central and eastern tropical Pacific ocean reaches at least 0.5°C, or about 1°F, warmer than average.
What causes it?
Typically, easterly ‘Trade Winds’ winds blow along the equator in the Pacific, this normally piles up warm water in the western Pacific – while in the eastern Pacific, cooler water from deeper in the ocean gets pulled up to replace the warm water pushed west.
However, during an El Niño, these trade winds weaken, so the warm waters slide back towards the central and eastern Pacific, in what is known as an equatorial Kelvin Wave, so the central and eastern tropical Pacific waters get warmer, a hallmark of an El Niño. These warm waters have a positive feedback in weakening the trade winds further, and even reversing the winds, so strengthening El Niño.
Record Strong ‘Monster’ El Nino in 2015
Several indicators suggest that the current El Nino event underway is already one of the strongest observed, if not the strongest, ever recorded. One of the strong scientific indicators are Oceanic Kelvin waves, as they help carry the warm West Pacific waters eastward across the Pacific. One record Kelvin Wave raged eastward across the equatorial Pacific in spring 2014, which seemed to kick start the warming last year towards El Nino conditions. Further impressive Kelvin waves in the Pacific Ocean this year continue to result in upward spikes of the ENSO 3.4 Index, a standard index to monitor the magnitude of El Nino conditions in the ocean via sea-surface temperature anomalies. The ENSO regions of the equatorial Pacific are shown below:
A look at the great red scar spanning more than half of the Equatorial Pacific Ocean on the upper Climate map (below) indicates it’s a Monster El Nino year. This zone is now showing an amazing +1.26 C sea surface temperature anomaly above the already hotter than normal 1979-to-2000 average. As a result, the Equatorial atmosphere continues to contribute to global temperatures that for 2015 will be the hottest ever recorded over the past 135 years.
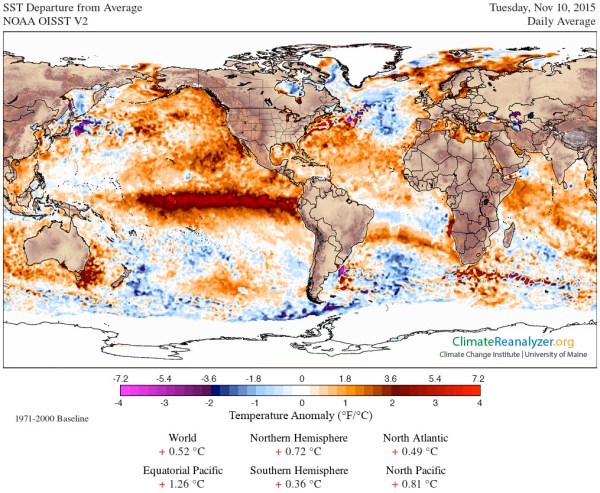
No two El Ninos are exactly alike as they can vary in intensity and distribution of warmest temperatures in the ENSO regions, as indicated in the map above. Furthermore, El Nino/ENSO is not the sole driver of our weather, but works in tandem with other drivers such as solar activity, winds in the tropical stratosphere (measured by the Quasi Biennial Oscillation), heat fluxes from snow cover, global sea surface temperatures, day-to-day blocking patters, etc. Changes in the behaviour or the dominance of any of the other drivers of our weather, then different weather may be experienced between winters where a strong El Nino is present.
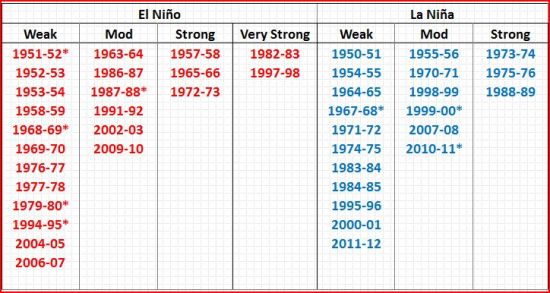
Below lists the seven strongest El Nino events since 1950, using the Multivariante ENSO index (MEI). Alternatively, the Oceanic Nino Index (ONI) shows strongest/weakest El Nino/La Nina years.
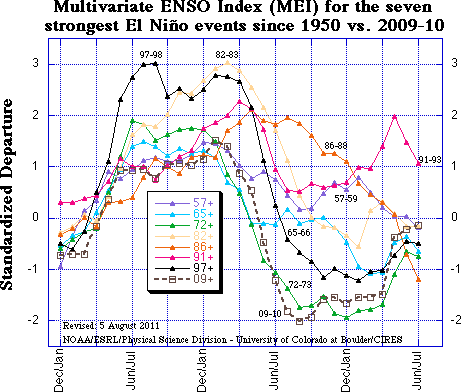
Cold & snowy UK winters with El Nino
2009/10 is listed as having a moderate El Nino (1.0-1.4C SST anomaly) on the ONI index, above, though doesn’t appear in the MEI top 7. The winter of 09/10 was then the coldest winter since 1978-79, with a mean temperature of 1.5 °C (34.7 °F). However, unlike this autumn and coming winter, solar activity had reached a minimum during that winter which probably contributed. Also, the Quasi Biennial Oscillation was in an easterly phase. An easterly phase of the QBO often coincide with more sudden stratospheric warmings, a weaker Atlantic jet stream and cold winters in Northern Europe and eastern USA.
1986/87 is listed as having a moderate El Nino on the ONI index, though on the MEI is one of the top 7 strongest El Ninos since 1950. January 1987 was an exceptionally cold month with much snow in places, as was March that year. Again, like winter 09/10, solar sunspot activity was at a minimum and an easterly QBO was present. (See graphs below for historic solar activity and QBO phase)
1965/66 is listed as having a strong El Nino on the ONI index and in the top 7 on the MEI. Winter 65/66 saw colder than average December and January, with quite a bit of snow in the east between the 14th and 22nd January, though February was mild. Again, the winter was during a minimum in solar activity and also the QBO was in an easterly phase.
Mild UK winters with El Nino
1997/98 is listed as very strong on the ONI index and is the strongest on record, along with 1982/83, on the MEI. The winter of 97/98 was rather mild, expectionally so in February, the warmest February of the century. A new record Feb temperature of 19.7C was recorded at Greenwich on the 13th. That winter was just coming out of a solar minimum and the QBO was neutral to slightly easterly.
1972/73 is listed as having a strong El Nino on the ONI index and is in the top 7 on the MEI. The winter was mild overall, though there were a few cold snaps. Sunspot activity was on a downward trend from its peak in 1970, though the minimum that decade wasn’t until 1976. The QBO was easterly during much of 1972 though to turn westerly in the New Year.
1987/88 El Nino listed as moderate on the ONI, but doesn’t appear in the MEI top 7. The winter was mild overall and quite wet and stormy. The winter was just coming out of a solar minimum with the QBO turning westerly into the New Year.
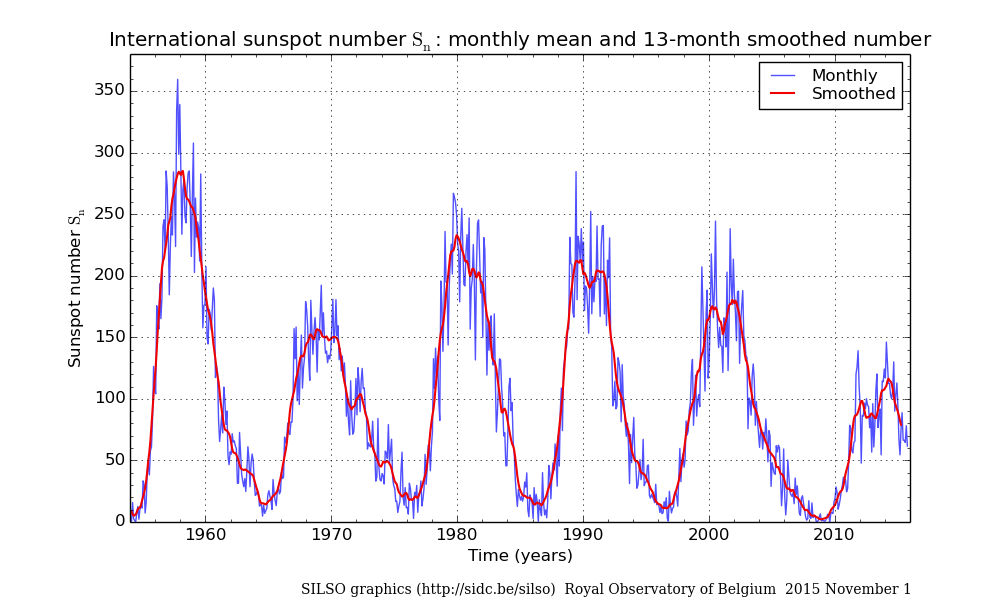
Solar Activity:
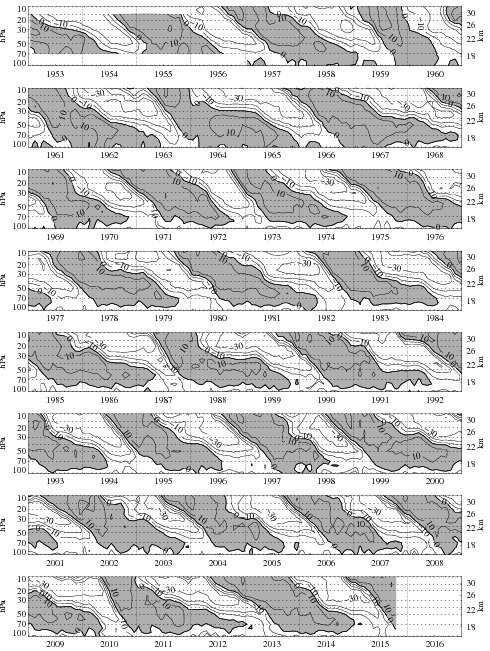
Quasi Biennial Oscillation Index (grey/shaded areas are westerly phase)
Correlation between El Nino and UK winters.
Above is just a snapshot of cold and mild winters during El Nino episodes, but it is apparent that a moderate or strong El Nino can still bring a cold winter if given solar activity is low and the QBO is solidly in an easterly phase.
Of course there are other drivers too that maybe at play. The Snow Cover Extent (SCE) is a fairly new index used to quantify the amount of snow cover present across the continent of Eurasia during the month of October. The logic behind this tool is that during high snow cover years in Eurasia, the Siberian snow cover expands during October – inducing surface cooling and strengthening the Siberian high. As result, the tropospheric jet amplifies, enhancing poleward heat flux or vertical wave propagation. This, in turn, weakens (warms) the Stratospheric Polar Vortex as we head into winter. So by January, typically stratospheric warming then propagates into the troposphers, creating a negative Arctic Oscillation (AO) and thus increasing the risk of cold and snowy weather across the UK, as the jet stream is forced much further south with the UK on the cold side of the jet stream.